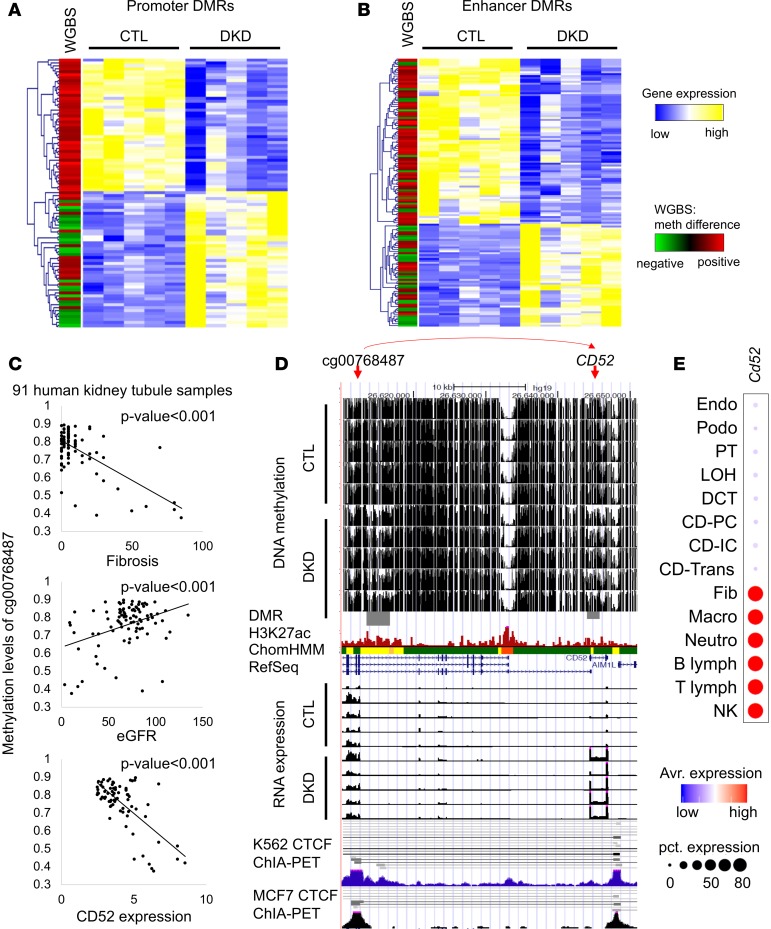
Figure 2. Association between DNA methylation and gene expression in human kidney tubules.
(A) Heatmap showing relative gene expression of control and DKD samples (yellow/blue); the differential methylation is shown in the first column (red/green). Association between gene expression and promoter DMRs. The genes that contain DMRs in their promoter region (TSS ± 3 kb) were clustered based on gene expression patterns. Each row is 1 DMR/gene and each column is 1 sample. (B) Heatmap showing relative gene expression of control and DKD samples (yellow/blue); the differential methylation is shown in the first column (red/green). Association between gene expression and the enhancer DMRs. Enhancers that are outside of promoter regions were linked to the nearest genes. Genes were clustered based on gene expression patterns. Each row is 1 DMR/gene and each column is 1 sample. (C) The methylation of cg00768487 was associated with interstitial fibrosis, kidney function (eGFR), and CD52 gene expression. (D) Screenshot of UCSC genome browser for the probe shown in C and the target gene CD52. The y axis shows WGBS DNA methylation level (control and DKD) followed by DMR highlight, human kidney H3K27ac ChIP-seq, ChromHMM data, and RNA expression (by RNA sequencing) and ChIA-PET data from K562 and MCF7 cells. ChromHMM color code as shown in A. (E) The expression of Cd52 in mouse kidney cells as identified by single-cell RNA sequencing (28).

