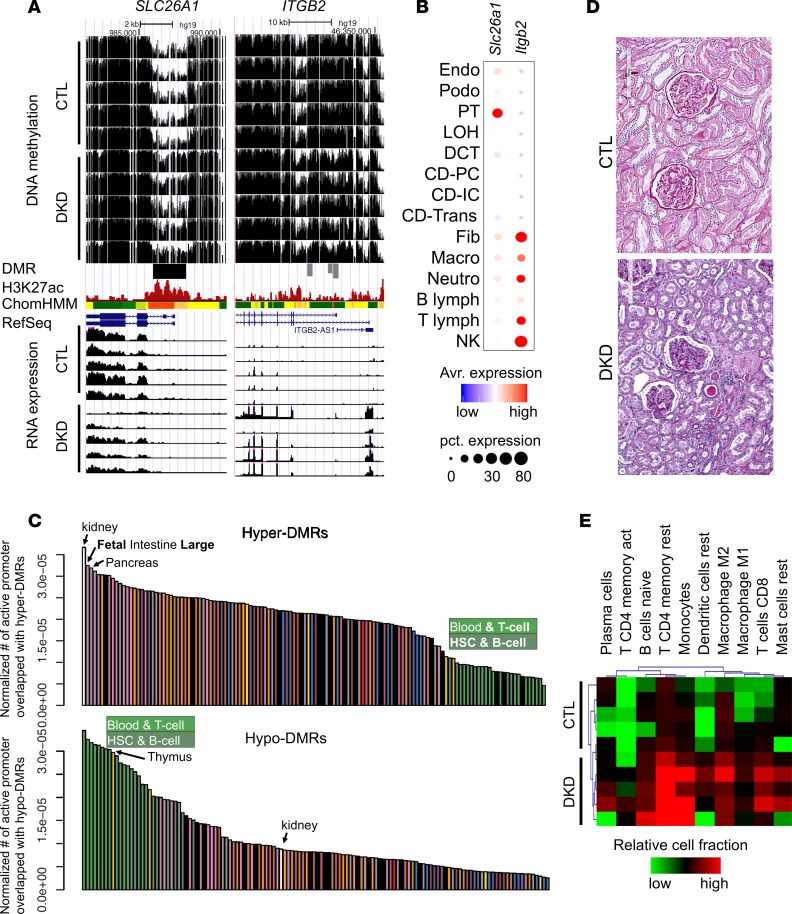
Figure 3. Differential methylation is driven by cell composition and cell type–specific changes.
(A) WGBS DNA methylation level (control and DKD) followed by DMR highlight, human kidney H3K27ac ChIP-seq, ChromHMM data, and RNA expression (by RNA sequencing). (B) The expression of Slc26a1 and Itgb2 in mouse kidney cells as identified by single-cell RNA sequencing. (C) Normalized enrichment of DMR by tissue-specific promoter regions. The y axis is the number of tissue-specific active promoters overlapping with hyper- and hypo-DMRs normalized by total length of tissue-specific active promoters. (D) Periodic acid–Schiff staining of kidney sections from control and DKD samples. (E) In silico deconvolution (by CIBERSORT) of bulk RNA sequencing data from normal and DKD human samples. Colors represent relative immune cell fractions in different samples.

