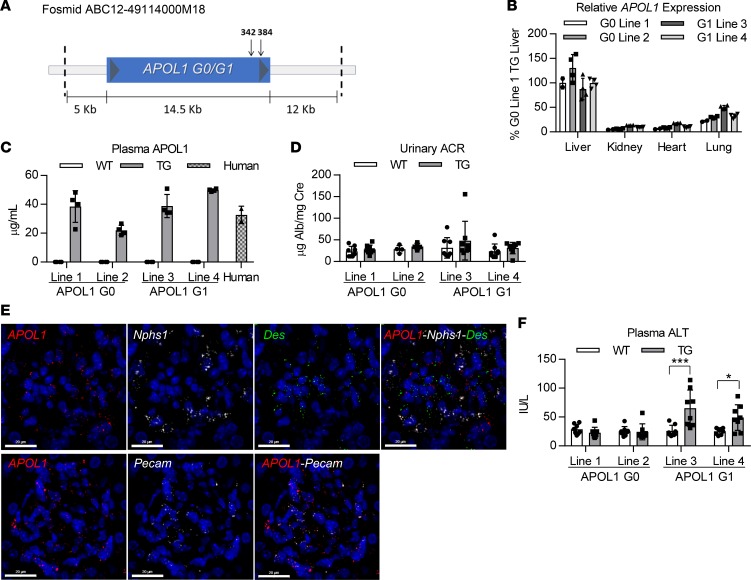
Figure 1. Genomic APOL1-transgenic mice express APOL1 in similar tissues as those observed in humans and at similar relative physiological levels.
(A) Schematic of the human APOL1-containing fosmid fragment used to generate APOL1 G0– and G1–transgenic mice. Arrows mark the protein coding sequence location of the 2 point mutations that constitute the G1 genotype. (B) Relative APOL1 expression levels in livers, kidneys, hearts, and lungs of transgenic mice (n = 2–4) were measured by qRT-PCR and normalized to total RNA. Data from 2 different founder lines are shown for each genotype. (C) APOL1 plasma levels in transgenic mice (n = 4) and human pooled plasma (n = 2) were measured by ELISA. (D) Urine albumin levels of APOL1-transgenic and WT littermate mice (n = 4–8) were measured by albumin ELISA and normalized to urine creatinine levels. (E) FISH was used to evaluate APOL1 mRNA expression in podocytes (Nphs1), mesangial cells (Des), and endothelial cells (Pecam) in APOL1 G1 mouse kidneys (n = 4). Representative images shown (scale bar: 20 μm). (F) Plasma ALT levels of APOL1-transgenic and WT littermate mice (n = 8) were measured using a clinical chemistry analyzer. Two-way ANOVA with Bonferroni’s multiple comparisons test, *P < 0.05; ***P < 0.001. All data are presented as mean ± SD.

