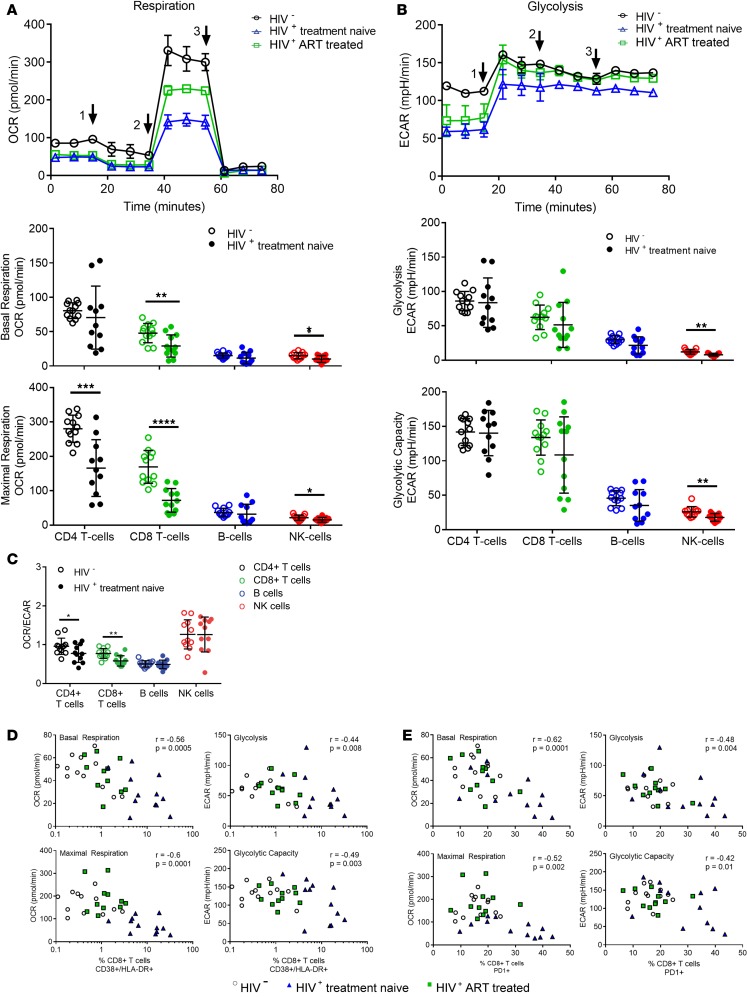
Figure 1. CD4+ and CD8+ T cells and NK cells from HIV-positive, treatment-naive patients (n = 11) show reduced basal and maximal respiration compared with HIV-negative patients (n = 12).
(A) Representative plot of oxidative consumption rate (OCR) showing subsequent injections of test components (marked with arrowheads) (1) oligomycin, (2) FCCP, and (3) rotenone with antimycin A. Comparison of basal and maximal mitochondrial respiration between HIV-positive, treatment-naive individuals and healthy controls demonstrating reduced basal and maximal respiration of CD4+ and CD8+ T cells and NK cells in HIV-positive, treatment-naive individuals. (B) Representative plot of extracellular acidification rate (ECAR) with the same injection strategy as the previous test. No significant differences in glycolysis and glycolytic capacity were observed among CD4+ and CD8+ T cells and NK cells. (C) OCR/ECAR ratio showing differences in the bioenergetic profiles. (D) Negative correlation between activation (characterized as CD38+ HLA-DR+) and metabolism in CD8+ T cells. (E) Negative correlation between exhaustion (characterized as PD-1+) and metabolic parameters in CD8+ T cells. Plots show individual values with the mean ± SD. Bar chart shows the mean value ± SD. Statistical significance was assessed by Kruskal-Wallis test with Dunn’s multiple-comparisons test and repeated-measures (RM) 1-way ANOVA test with Holm-Šídák’s multiple-comparisons test (*P < 0.05; **P < 0.01; ***P < 0.001; ****P < 0.0001).

