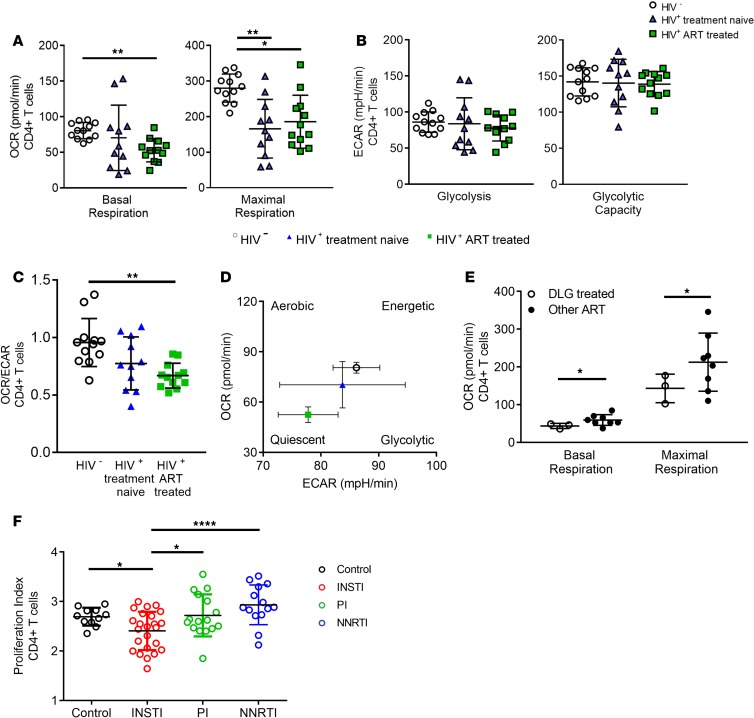
Figure 2. CD4+ T cells from HIV-positive, treatment-naive (n = 11) and ART-treated individuals (n = 12) display reduced basal and maximal respiration compared with HIV-negative individuals (n = 12).
(A) Comparison of basal and maximal mitochondrial respiration between HIV-positive treatment-naive and treated individuals and healthy controls demonstrating reduced basal and maximal respiration of CD4+ T cells in ART-treated individuals. (B) No significant differences in glycolysis and glycolytic capacity of CD4+ T cells in the 3 groups. (C and D) Schematic graphs of bioenergetic profiles of ART-treated, chronically untreated, and healthy individuals, as shown in differences in OCR/ECAR ratio highlighting differences in the bioenergetics profiles between the 3 groups. (E) Decreased OXPHOS of ART-treated, HIV-positive individuals receiving a DLG-containing regimen (open circles) compared with PI-containing, NNRTI-containing (black circles). (F) Significantly decreased proliferation of CD4+ T cells of ART-treated, HIV-positive individuals receiving an INSTI-containing regimen compared with PI-containing and NNRTI-containing regimens. Bar chart shows the mean value ± SD. Statistical significance was assessed by Kruskal-Wallis test with Dunn’s multiple-comparisons test and RM 1-way ANOVA test with Holm-Šídák’s multiple-comparisons test (*P < 0.05; **P < 0.01; ****P < 0.0001).

