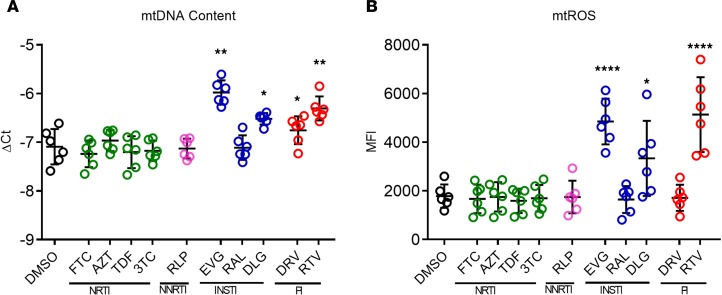
Figure 4. Shift in mitochondrial ROS production and mitochondrial content (measured as amount of mtDNA) after ART exposure for 3 days (n = 6).
(A) CD4+ T cells exposed to DLG, EVG, and RTV showed increased production of mitochondrial ROS (mtROS). (B) Increased mtDNA content of CD4+ T cells upon incubation with DLG, EVG, and RTV for 3 days. Plots show individual values with the mean ± SD. Statistical significance was assessed by RM 1-way ANOVA test with Holm-Šídák’s multiple-comparisons test (*P < 0.05; **P < 0.01; ****P < 0.0001).

