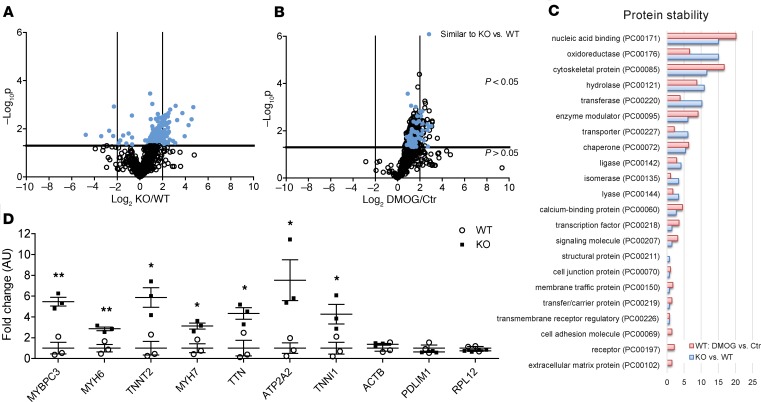
Figure 3. Analysis of light proteins in pulse-chase amino acid–labeled WT and OGFOD1-KO iPSC-CMs.
Human iPSC-CMs were analyzed 16 days after initiation of the differentiation. Cardiomyocytes were adapted to dialyzed FBS containing light medium (12C6–Lys, 12C614N4–Arg) for 3 days and then switched to heavy label (13C6 l-lysine-2HCl, 13C615N4 l-arginine-HCl). For the analysis of protein degradation, samples were harvested 6 hours after media switch. Samples underwent tryptic digestion and mass spectrometry analysis. Quantitative analysis was performed by QUOIL. Volcano plot analysis for light proteins showing basal differences in protein degradation in OGFOD1-KO versus WT (A) or WT Ctr versus DMOG (1 mM) (B), with n = 3 biological samples per group. The horizontal line represents the threshold of P = 0.05; the vertical lines represent the threshold for the log2FC. The x axis depicts the log2 difference in protein synthesis. (C) Protein class analysis was performed for proteins with significant differences in protein synthesis with PANTHER. Protein classes are shown as percentage of total number of identified protein classes. (D) Protein stability for selected cardiac proteins undergoing stabilization versus selected proteins without significant changes in protein stability at different time points after initiation of labeling. Data are shown as mean ± SEM. **P < 0.01 and *P < 0.05 vs. WT (2-way ANOVA plus Bonferroni’s posttest).

