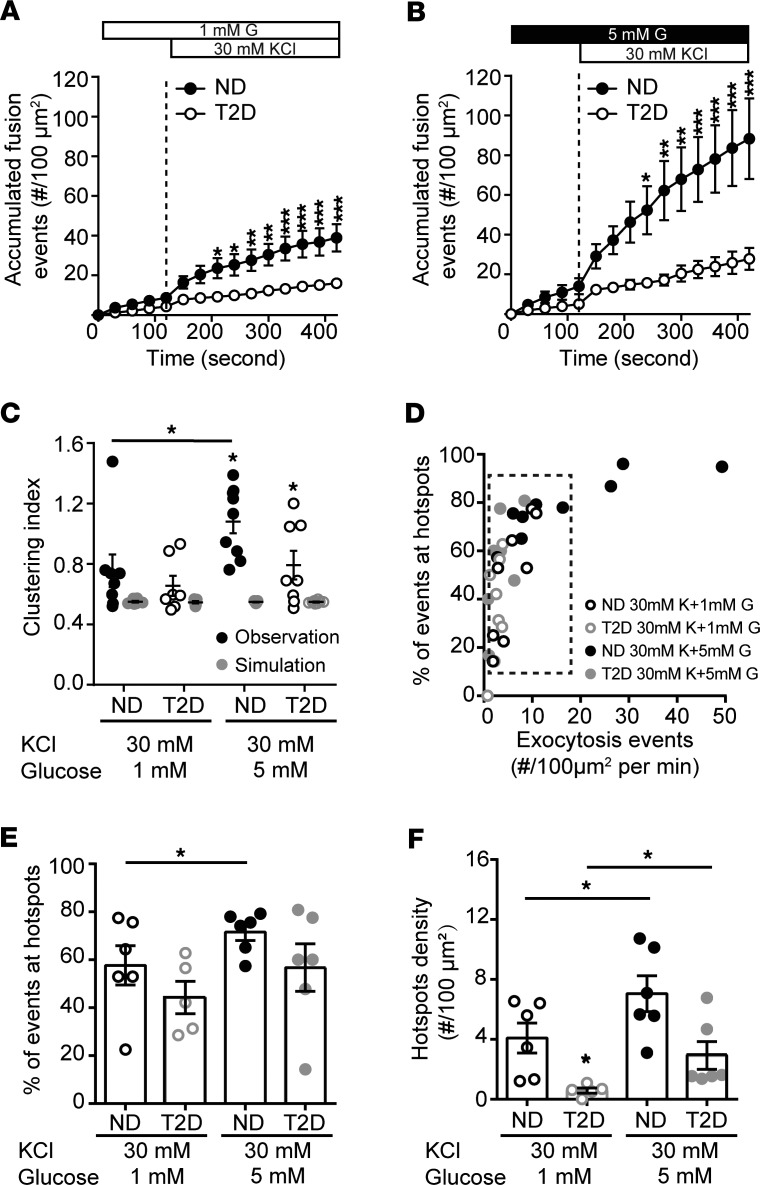
Figure 3. Glucose regulates the spatial organization of fusion events.
(A and B) Accumulated fusion events monitored by TIRF microscopy of ND β cells (black circles) and T2D β cells (open circles) expressing NPY-EGFP, in response to (A) KCl at 1 mM (n = 7 and 8 cells from 6 ND and 3 T2D donors) and (B) 5 mM glucose (n = 9 and 9 cells from 6 ND and 3 T2D donors). (C) The uniform index is increased at 5 mM glucose in the ND (closed symbols) but not T2D (open symbols) β cells. (D) Scatter plot showing total fusion events versus the proportion of events in spatially restricted clusters. Cells with similar exocytosis (dashed box) used for further analysis. (E) The proportion of events occurring in organized clusters and (F) the density of these clusters are increased at 5 mM glucose in ND β cells but impaired in T2D β cells. Significance was determined by ANOVA and Bonferroni’s posttest. *P < 0.05; **P < 0.01; ***P < 0.001.

