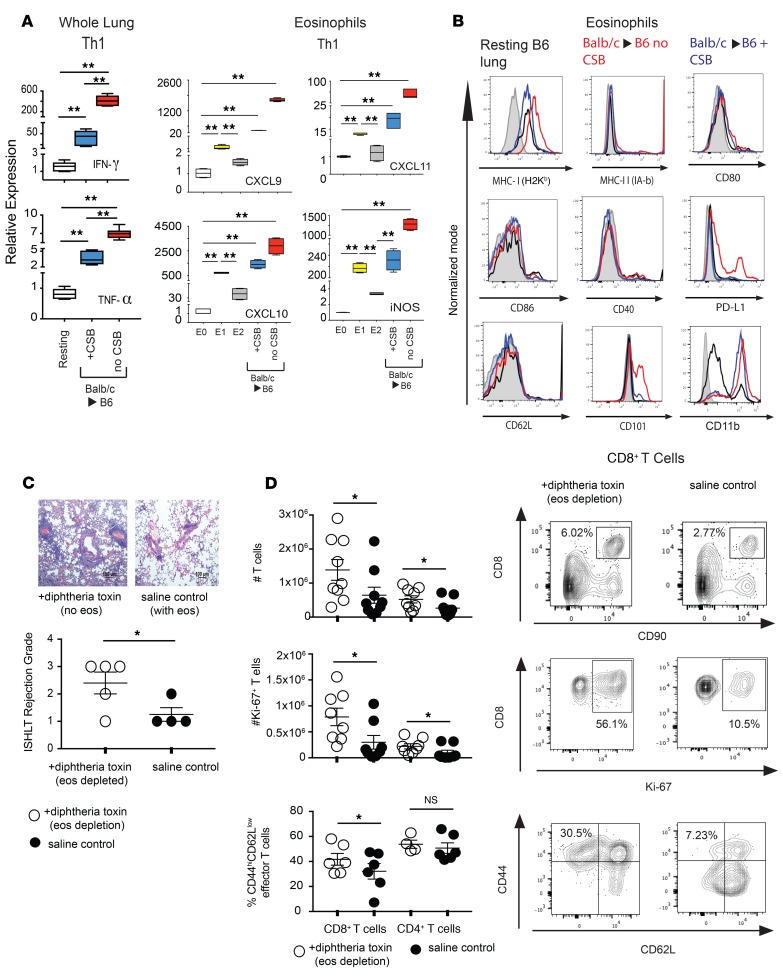
Figure 1. Th1 polarization of the lung allograft.
(A) Seven days after transplantation of BALB/c lung allograft to B6 recipient with or without CSB immunosuppression, the whole lung allograft (left) or flow cytometrically sorted lung-resident eosinophils (right) were phenotyped for Th1 or Th2 polarization using established markers. Comparison was made to E0 resting blood-resident eosinophils (white) or eosinophils polarized to the E1 (Th1) phenotype by overnight exposure to IFN-γ and TNF-α (yellow) or E2 (Th2) phenotype by overnight exposure to IL-33, IL-4, and GM-CSF (gray). Representative of 4 to 6 transplants per group, with Th2 analysis presented in Supplemental Figure 1. (B) Flow cytometric analysis of lung-resident eosinophils in BALB/c to B6 lung allografts with (blue) or without (red) CSB. Analysis of eosinophils from resting, untransplanted, B6 lungs shown as black line, while isotype control is shaded in gray. Representative of 3 to 5 separate transplants. (C) Histologic and flow cytometric analysis of BALB/c→iPhil transplants depleted of eosinophils with treatment by DT or saline control. Representative histologic section (top) and ISHLT A grade of rejection (bottom). Scale bar: 100 μm. (D) Total number of graft-resident T cells (top left) and a representative plot of flow cytometrically analyzed lung digest defining CD8+ T cells as CD90+CD8+ (top right). Total number of proliferating Ki-67+ T cells (middle left) and a representative plot of Ki-67+ CD8+ T cells (middle right). Relative proportion of effector T cells (defined as CD44hiCD62Llo) (bottom left) and a representative plot of CD8+ T cell effector differentiation (bottom right). All statistics performed by Mann-Whitney U test. *P < 0.05; **P < 0.01; nsP > 0.05.

