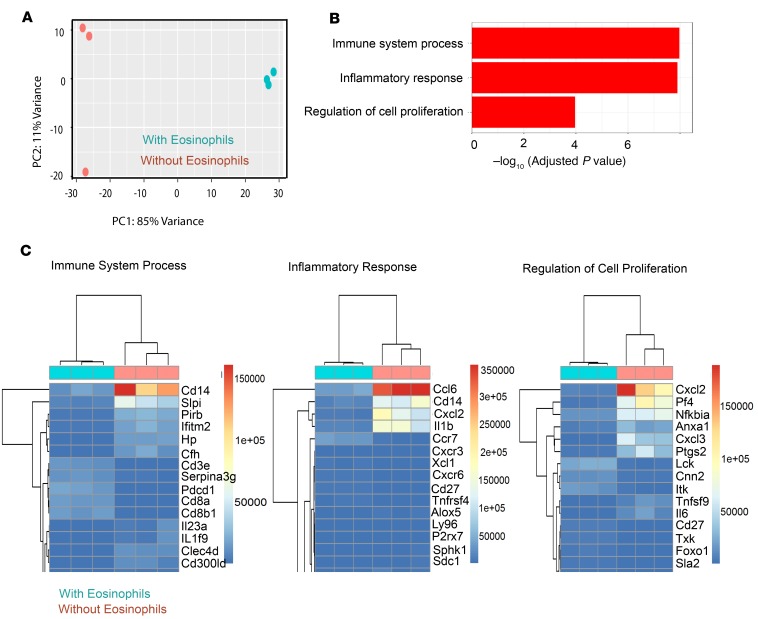
Figure 2. Gene expression analysis of lung allograft–resident CD8+ T cells in the presence or absence of eosinophils.
(A) Graphic representation of the relationship among samples of the same group and the difference between the 2 groups of samples, based on the principle component analysis of the top 500 genes, selected by highest row variance. (B) Three of the top gene clusters upregulated in lung allograft–resident CD8+ T cells in eosinophil-deficient B6 recipients of BALB/c lungs as determined by gene ontology analysis using GeneSCF software. (C) Detailed heatmaps defining the relative levels of the top 15 genes in the inflammatory response, immune system process, and regulation of cell proliferation pathways defined as part of gene ontology analysis.

