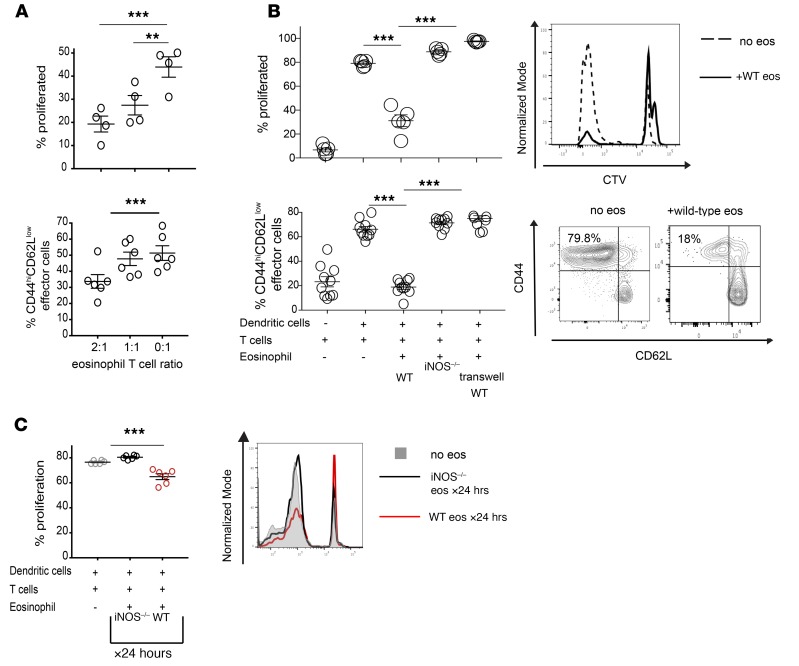
Figure 3. In vitro inhibition of T cells by E1-polarized eosinophils.
(A) In vitro mixed leukocyte reactions (MLRs) established using anti–CD3/CD28 Dynabead stimulation of B6 T cells with varying ratios of E1-polarized B6 eosinophils added to the culture. The graph demonstrates percentage proliferation, as defined by the dilution of the CellTrace Violet (CTV) proliferation dye, and effector differentiation, as defined by the percentage of CD44hiCD62Llo CD8+ T cells after 5 days of coculture. Representative data from 1 out of 3 similar experiments. (B) Proliferation and effector differentiation of B6 CD8+ T cells stimulated by BALB/c dendritic cells in a coculture with a 2:1 ratio of eosinophils to T cells. For some conditions, WT or iNOS–/– eosinophils were added directly to the dendritic cell–T cell cocultures, while in other conditions the eosinophils were separated from the dendritic cell–T cell cocultures by a semipermeable membrane. Summary of data shown on the left, and representative flow cytometry plots on the right. Representative data from 1 out of 3 similar experiments. (C) MLRs, similar to those demonstrated in A were set up with a 2:1 ratio of eosinophils to T cells, except E1-polarized eosinophils were removed from the culture after 24 hours (X24 hrs) and T cell proliferation was analyzed on day 5 of the MLR. Summary of data shown on the left, and representative flow cytometry plot on the right. All statistics performed by Mann-Whitney U test. **P < 0.01; ***P < 0.001.

