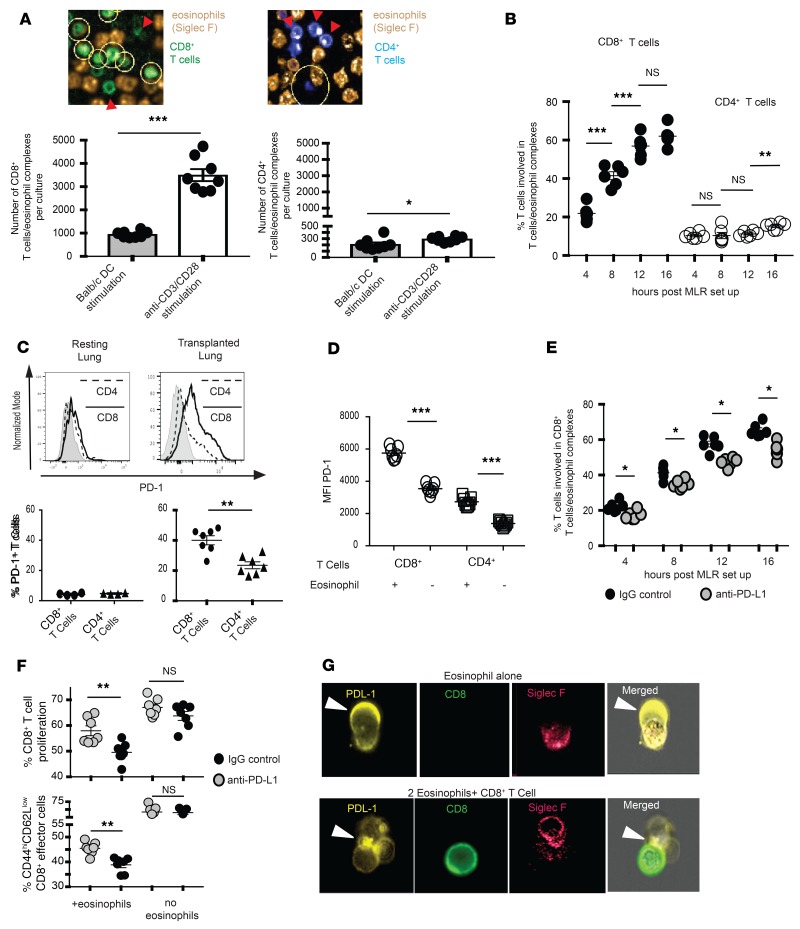
Figure 5. PD-L1–mediated T cell–eosinophil interaction.
(A) In vitro MLRs established using the coculture of bone marrow–derived BALB/c dendritic cells or anti–CD3/CD28 Dynabeads, and fluorescently labeled CD8+ and CD4+ B6 T cells with a 2:1 ratio of E1-polarized fluorescently labeled B6 eosinophils. Eosinophil–T cell interactions were analyzed using Harmony Software. Yellow circles in the top graphic representation demonstrate Harmony Software–detected T cell–eosinophil interactions, which are quantitated in graphic form at the bottom. (B) Quantification of T cell–eosinophil interaction during 16 hours of coculture in vitro as determined by Harmony Software analysis of live confocal microscopy. (C) PD-1 expression in CD4+ and CD8+ T cells of resting and transplanted murine lungs in vivo. Graphic representation at the top, and quantification of percentage of T cells expressing PD-1 at the bottom. (D) PD-1 expression on T cells in in vitro MLRs stimulated with anti–CD3/CD28 Dynabeads in the presence or absence of WT eosinophils. (E) CD8+ T cell–eosinophil interactions in the presence of PD-L1 blockade during 16 hours of coculture in vitro, as determined by Harmony Software analysis of live confocal microscopy. (F) CD8+ T cell proliferation and effector differentiation in the presence or absence of eosinophils and PD-L1 blockade in in vitro MLRs with anti–CD3/CD28 Dynabead stimulation. All MLRs in A–F demonstrate 1 experiment from 2 to 3. (G) ImageStream analysis of eosinophil–T cell MLRs for surface analysis of PD-L1 expression and polarization. All statistics performed by Mann-Whitney U test. *P < 0.05; **P < 0.01; ***P < 0.001; nsP > 0.05.

