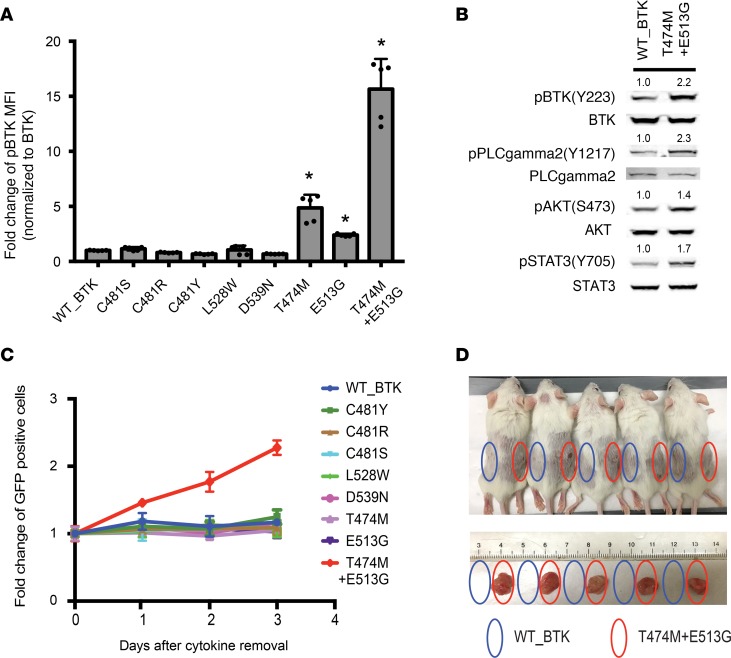
Figure 4. Functional analysis of drug-resistant BTK mutants.
(A) FACS analysis of BTK (Y223) autophosphorylation comparing wild-type BTK and the indicated mutant BTK alleles. Data are represented as mean ± SD from 2 independent experiments. *P < 0.05 vs. WT_BTK determined by Student’s t test. (B) Immunoblot of Ba/F3 lysates expressing wild-type and mutant BTK probed for indicated BTK downstream molecules. Total protein was used as a control and quantification was done with ImageJ. (C) Proliferation of Ba/F3 cells expressing mutant BTK and GFP in the absence of IL-3. (D) In vivo tumorigenicity of 1 × 10⁷ Ba/F3 cells expressing wild-type or mutant BTK (T474M and E513G) injected into the flanks of NSG mice; below, tumors harvested after 4 weeks.

