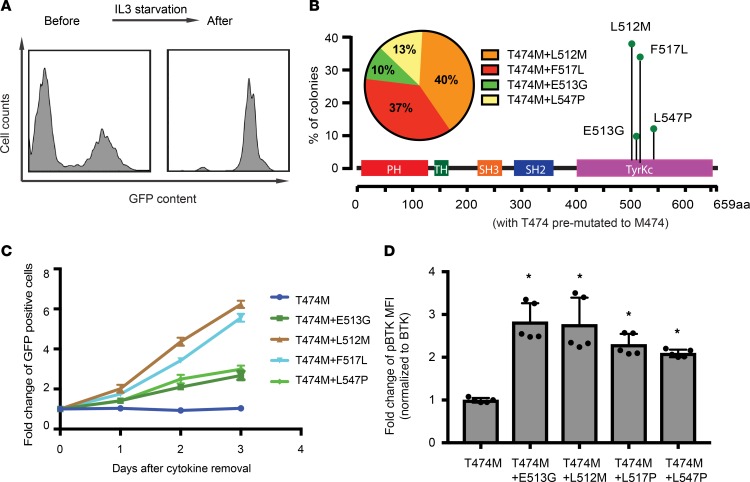
Figure 5. Sensitized screen for transforming BTK mutations in the context of the BTKT474M gatekeeper allele.
(A) FACS analysis of Ba/F3 cells shows enrichment of GFP (coexpressed with the mutant BTKT474M library) after IL-3 starvation. (B) Sequence analysis of 156 colonies from Ba/F3 cells indicates frequency and location of secondary mutations in the context of the T474M mutation. (C) Confirmation of IL-3–independent growth for the indicated BTK mutants coexpressed with GFP and measured relative to nontransduced parental cells (indicated as percentage of GFP-positive cells). (D) FACS analysis of BTK autophosphorylation (Y223) in HEK293T cells expressing the indicated BTK alleles. Data are represented as mean ± SD from 2 independent experiments. *P < 0.05 vs. BTK_T474M determined by Student’s t test.

