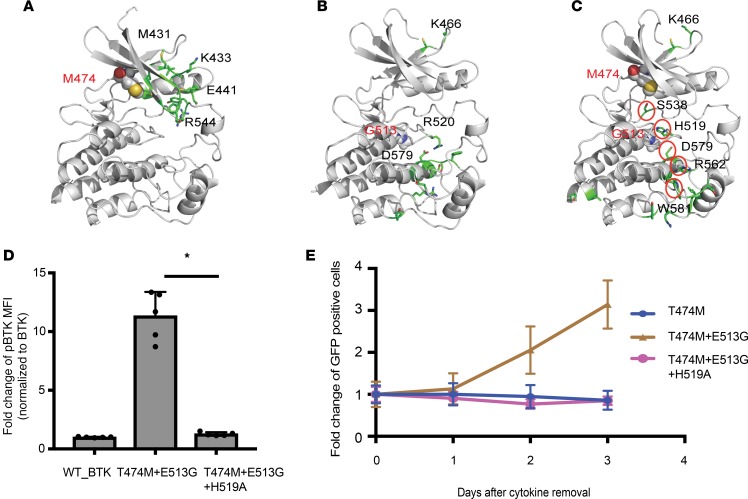
Figure 6. Modeling and testing the cooperative effects of the BTK double mutein.
(A–C) All-atom MD simulations comparing T474M (A), E513G (B), and the double mutants (T474M and E513G) (C) with wild-type BTK. The residues computed to have differential frequency of contacts in the mutant compared with the wild-type BTK are highlighted in stick representation in the protein model. Mutated residues are highlighted in all-atom CPK representation. A structural pattern of residues with differential contacts emerges for the double mutant, connecting the mutations to distant residues implicated in activation, viz. D579 and H519. (D) H519A mutation reverts the increased BTK Y223 autophosphorylation of cells expressing BTK_T474M+E513G to wild-type BTK levels as measured by FACS in HEK393T cells. Data are represented as mean ± SD from 2 independent experiments. *P < 0.05 determined by Student’s t test. (E) H519A further abrogates IL-3–independent growth in Ba/F3 cells expressing BTK_T474M+E513G.

