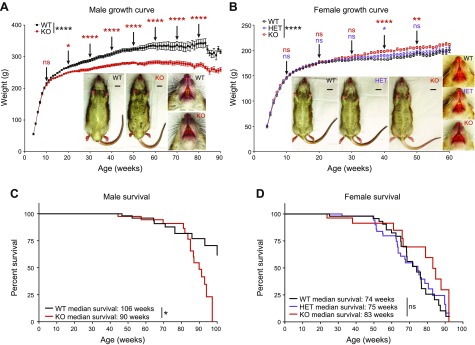
Figure 1.
Fabry rat appearance and survival. A) WT and KO male rat weights are plotted with age. Representative ventral body and face images are shown (inset). Body images are from 39-wk-old rats, and face images are from 52-wk-old rats. B) Similar to A but with WT, HET, and KO female rat weights and images shown. A, B) Means ± sem are plotted, and the exact number of biologic replicates at each week are given in Supplemental Table S1. A 2-way ANOVA was used to calculate the overall effect of genotype on rat weight, and overall significance is shown to the right of each legend. Significant differences in genotype were determined at each time point using Bonferroni’s multiple comparison test, and for simplicity, the results are only shown every 10 wk. C) Male survival curve that is representative of all rats studied in the Fabry rat colony, where WT n = 153 and KO n = 173. Rats were counted as alive if they were still alive at the time of graph generation or if they were healthy but underwent a planned necropsy for organ collection. Rats were counted as dead if they died spontaneously or reached a humane endpoint and required euthanasia, as judged by the veterinary staff. A log-rank (Mantel-Cox) test was performed to compare WT with KO survival curves. D) Same as in C but with female rats, where WT n = 64, HET n = 75, and KO n = 40. *P < 0.05, **P < 0.01, ****P < 0.0001.

