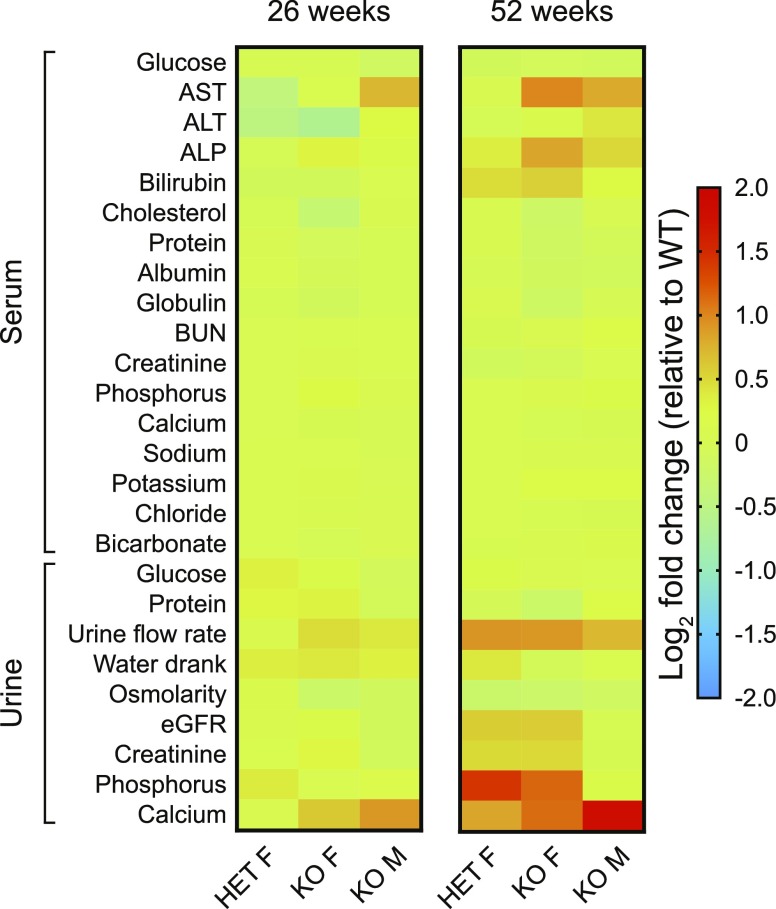
Figure 4.
Serum and urine chemistry alterations point to renal tubule dysfunction in Fabry rats. Shown are heat maps of serum and urine chemistry panel data from rat groups at 2 different ages: 26 and 52 wk. The log2 fold change is calculated by comparing HET and KO females with WT females and by comparing KO males with WT males. Each cell within the heat maps represents the log2 fold change obtained from mean chemistry values from ≥8 individual rats from each sex and genotype (WT males, KO males, WT females, HET females, KO females). The data are plotted with age in Supplemental Figs. S4–S6, and the exact numbers of biologic replicates are given in Supplemental Tables S2 and S3. ALP, alkaline phosphatase; ALT, alanine aminotransferase; AST, aspartate aminotransferase; F, female; M, male.

