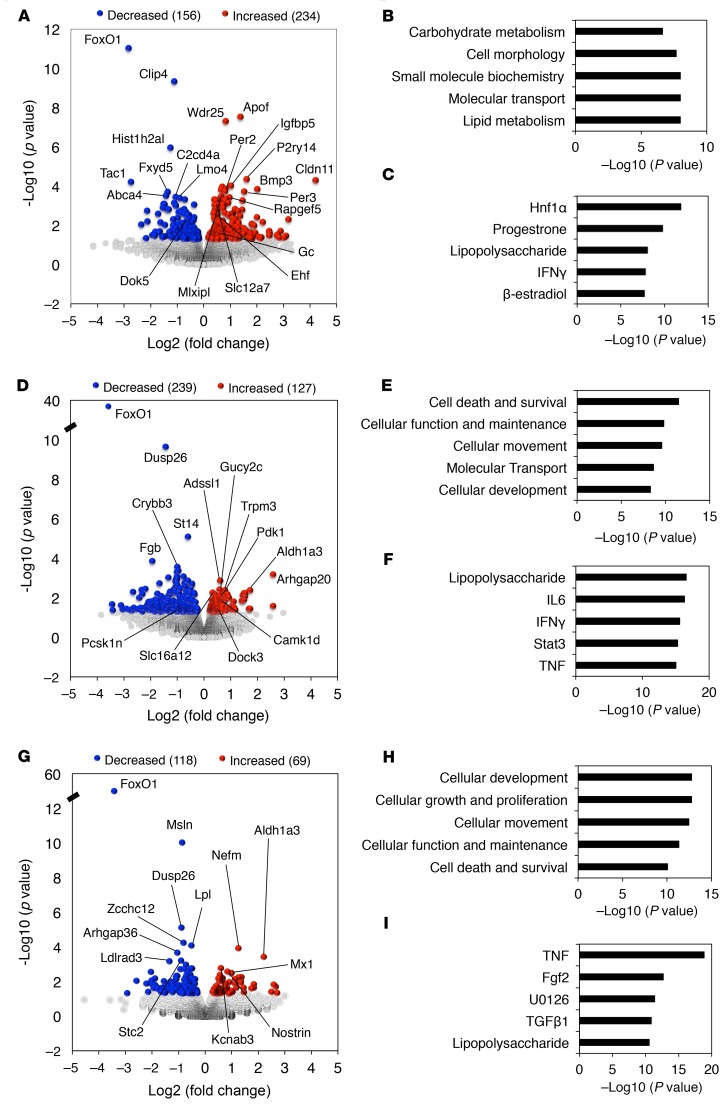
Figure 2. Genome-wide gene expression analysis in dedifferentiated β cells.
Volcano plots show 2-way comparison between (A) NGT versus DM, (D) 12M NP WT versus I-KO, and (G) 3M WT versus I-KO mice for RNA-Seq (n = 3 for each group), where y axis shows negative log10 (P value), and x axis represents log2 function of I-KO/WT. Ingenuity pathway analysis revealed top 5 molecular and cellular functions categorized by altered genes in (B) NGT versus DM, (E) 12M NP WT versus I-KO, and (H) 3M WT versus I-KO mice. Top 5 upstream regulators computed by ingenuity pathway analysis in (C) NGT versus DM, (F) 12M NP WT versus I-KO, and (I) 3M WT versus I-KO mice.

