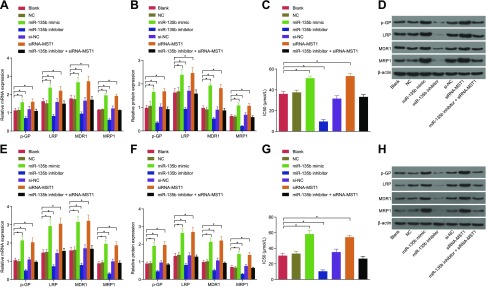
Figure 9.
Results of qRT-PCR, Western blot analysis, and MTT assay evaluated the decreased expression of miR-135b, which further revealed decreased expressions of MDR1, MRP1, LRP, and p-GP and decreased cell resistance to CDDP. A) mRNA expression of drug-resistant genes in MKN45 cells. B) Protein expression of drug-resistant genes in MKN45 cells after transfection. C) IC50 value of MKN45 cells in each group after transfection. D) Protein bands of drug-resistant genes in MKN45 cells after transfection. E) mRNA expression of drug-resistant genes in MKN28 cells. F) Protein expression of drug-resistant genes in MKN28 cells after transfection. G) IC50 value of MKN28 cells in each group after transfection. H) The protein bands of drug-resistant genes in MKN28 cells after transfection. The expression of drug-resistant genes related to GC cells after transfection and the IC50 is expressed as mean ± sd, and the data were detected by using 1-way ANOVA. The experiment was repeated 3 times. *P < 0.05 compared with the NC group.

