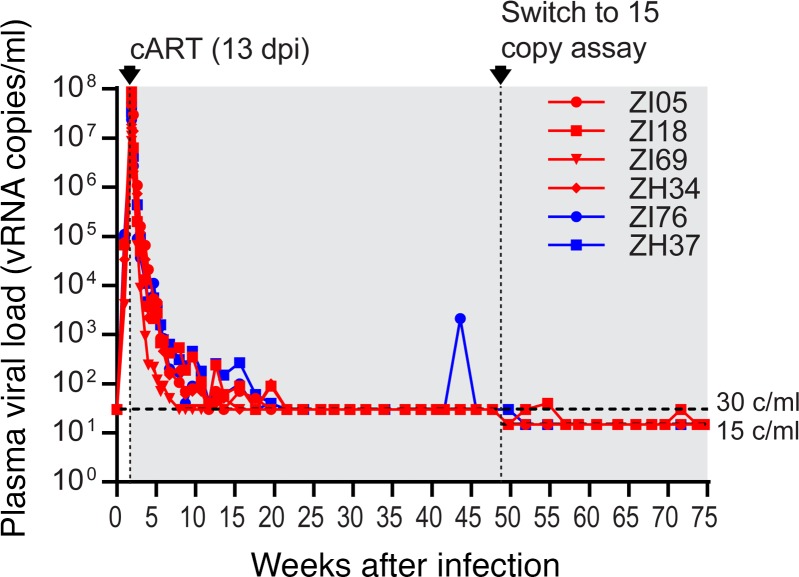
Figure 2. Plasma viral loads prior to GS-9620 administration.
Longitudinal SIV RNA quantification in plasma is shown for the first 75 weeks of the study, which includes time points from before cART through the first 73 weeks on cART (plot region with a gray background). Red plots are for animals later treated with GS-9620; blue plots are for vehicle control animals. The plasma viral load assay used was switched from one with a 30 vRNA copy/ml threshold sensitivity to one with a 15 vRNA copy/ml threshold sensitivity at the indicated time point. Plasma viral load data for these 6 animals through the first 42 weeks have been reported previously (42).

