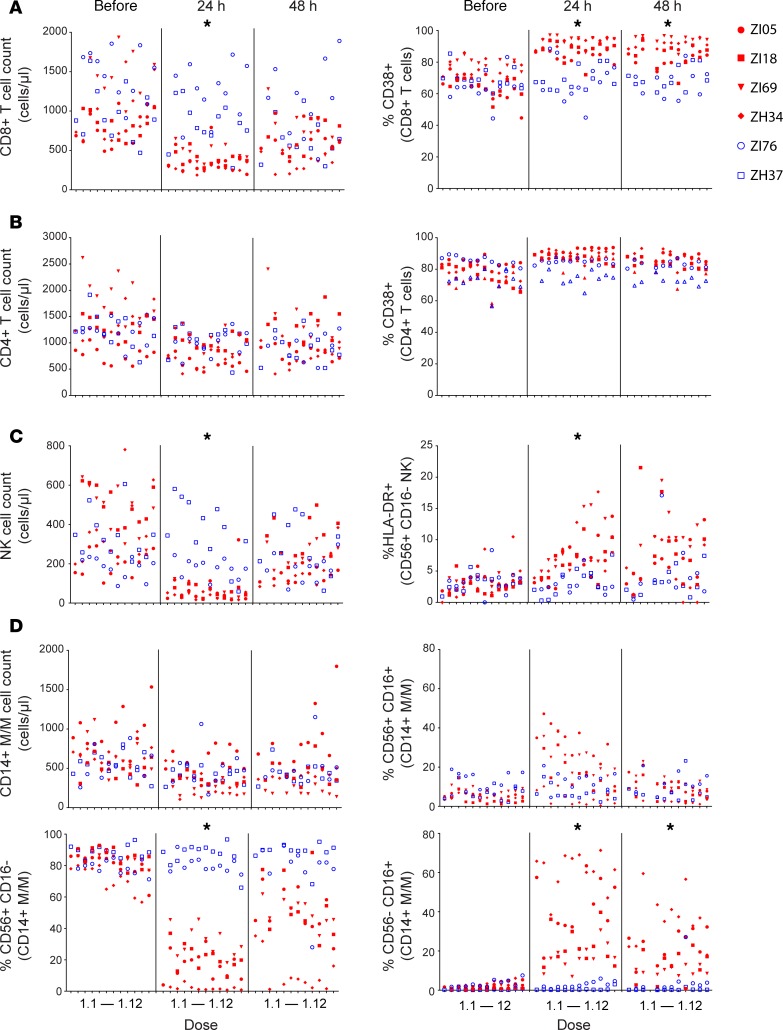
Figure 6. Immune cell populations respond to GS-9620 administration.
Absolute cell counts and the frequency of cells expressing the indicated cell surface markers in blood immediately prior to (Before) and at 24 hours and 48 hours following each of the 12 doses of the first course of GS-9620 (doses 1.1 through 1.12) are shown for CD8+ T cells (A), CD4+ T cells (B), NK cells (C), and monocyte/macrophage (M/M) cell populations (D). For A–D, GS-9620–treated animals are shown with red plot symbols and vehicle control animals are shown with blue plot symbols. Significant differences between GS-9620–treated and control animals across the 24-hour and/or 48-hour time points for individual measurements are indicated with an asterisk (P < 0.02). There were no significant differences between the groups for any of the measures across the pretreatment time points or any measurements/time points not indicated with an asterisk. At 24 hours, there was a trend toward elevated CD38+CD4+ T cell percentage in the GS-9620 treatment group (P = 0.073).

