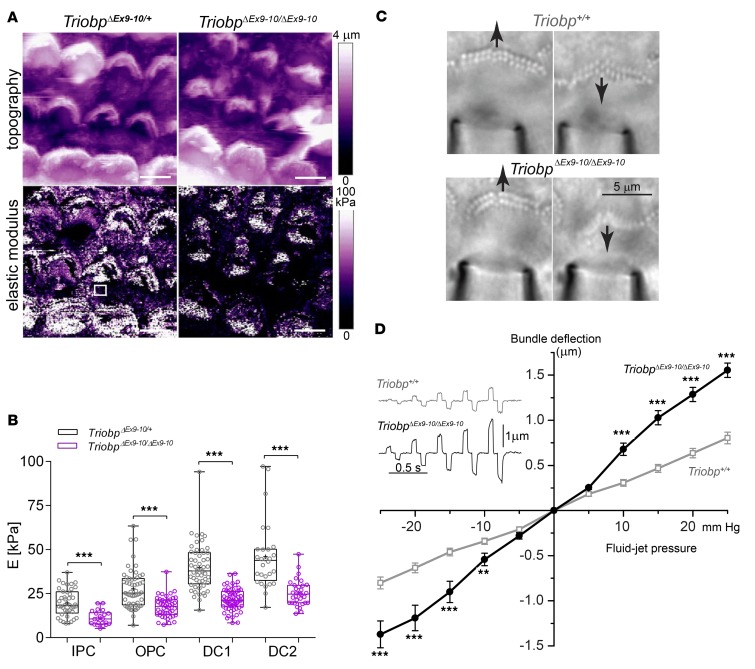
Figure 8. TRIOBP-5 deficiency results in decreased supporting-cell stiffness and fragile hair cell stereocilia.
(A) Topographic image (top) and stiffness map (bottom) of live organ of Corti explants (P5, cochlear middle turn) from TriobpΔEx9-10/+ heterozygotes (left) and TriobpΔEx9-10/ΔEx9-10 mutant littermates (right) visualized by atomic force microscopy using PeakForce Tapping mode (PFT-AFM). Transverse stiffness (E, elastic Young’s modulus) of the reticular lamina measured in regions of interest (ROIs) overlaying supporting cells (for example, white square in TriobpΔEx9-10/ΔEx9-10 stiffness image). Scale bars: 5 μm. (B) Box-and-whisker plots of E values on apical surfaces of inner pillar (IPC), outer pillar (OPC), and Deiters’ row 1 (DC1) and 2 (DC2) cells. Bars show mean ± SD Asterisks indicate statistical significance between Triobp-5+/ΔEx9-10 and Triobp-5ΔEx9-10/ΔEx9-10 cells. ***P < 0.001 (2-tailed t test with Welch’s correction). n indicates the number of cells. Data points represent individual supporting cells for TriobpΔEx9-10/+ mice (gray) and TriobpΔEx9-10/ΔEx9-10 mice (purple), 5 and 4 mice, respectively. (C) Deflections of stereocilia bundles by a fluid-jet in wild-type (top) and TriobpΔEx9-10/ΔEx9-10 live IHCs (bottom). Responses to maximal pressure steps of ±25 mmHg are shown. See also Supplemental Video 3. The puff pipette is visible at the bottom of the panels. (D) Average displacements of stereocilia bundles as a function of fluid-jet pressure in wild-type (gray open symbols) and TriobpΔEx9-10/ΔEx9-10 (black solid symbols) IHCs at P8. Alternating positive and negative stimuli presented in increasing order. Examples of bundle deflections are shown in inset. Number of cells (number of mice): wild-type, n = 44 (6); TriobpΔEx9-10/ΔEx9-10 n = 49 (6). Data are shown as mean ± SEM. Asterisks indicate statistical significance of differences between wild-type and TriobpΔEx9-10/ΔEx9-10 mice. **P < 0.01; ***P < 0.001 (t test of independent variables).

