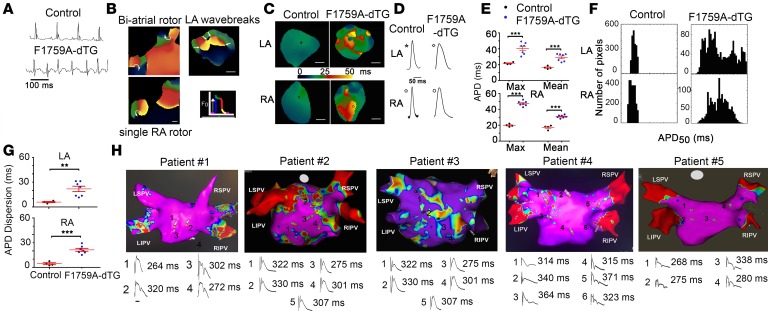
Figure 1. Inhomogeneity of APD in mice and humans with AF.
(A) Representative limb lead surface ECGs of isoflurane-anesthetized littermate control mouse in sinus rhythm (top row) and of F1759A-dTG mouse in AF (lower row). (B) Representative snapshots from phase movies of Langendorff-perfused F1759A-dTG hearts demonstrating simultaneous rotors in the right atrium (RA) and left atrium (LA), a predominant rotor in the RA, and wavebreaks and fibrillatory conduction in the LA. (C and D) Representative optical APD maps (C) and optical action potential tracings (D) from littermate control and F1759A-dTG mice. APD maps (pacing at 10 Hz) for F1759A-dTG mice were obtained after hyperkalemia-induced conversion to sinus rhythm. The circle marks the region corresponding to the optical action potential tracings in D. Scale bar: 1 mm. (E) Graph showing maximal (max) and mean APD50 in LA and RA of littermate control (n = 4) and F1759A-dTG mice (n = 7). Mean ± SEM. ***P < 0.001; 2-tailed Student’s t test. (F) Representative all-points histograms of APD. (G) Graphs of APD50 dispersion. Mean ± SEM for littermate control and F1759A-dTG mice. **P < 0.01; ***P < 0.01; 2-tailed Student’s t test. (H) Electro-anatomical voltage map (upper) and MAP recordings in sinus rhythm (lower) with APD90 measurement for the corresponding regions for 5 patients undergoing AF ablation. For the electro-anatomical voltage map, red color (0.2 mV) is indicative of low-voltage area consistent with scarred tissue, and purple (0.5–1.0 mV) is indicative of normal healthy tissue. LIPV, linferior pulmonary vein; RIPV, right inferior pulmonary vein; LSPV, eft superior pulmonary vein; and RSPV: right superior pulmonary vein.

