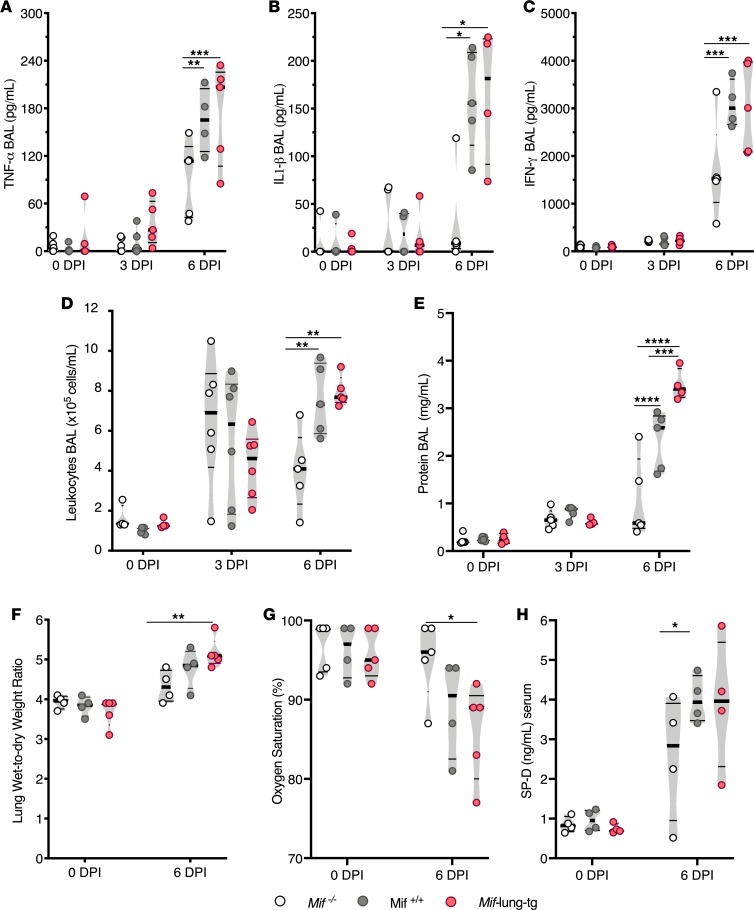
Figure 2. Higher MIF promotes inflammation and lung permeability during IAV infection.
(A) TNF-α, (B) IL-1β, and (C) IFN-γ levels in BAL, as measure by ELISA. (D) Total leukocytes in BAL. (E) Total protein concentration in BAL. (F) Wet/dry weight ratios of lungs. (G) Arterial oxygen saturation determined by pulse oximetry. (H) Serum concentrations of surfactant protein D (SP-D). Statistical differences were determined by 2-way ANOVA followed by Tukey multiple comparisons test. The violin plots are closed curves representing data distribution and encapsulate the median, range, and interquartilerange, with each symbol representing a biological replicate. Data are representative of samples from 2 independent experiments, with n = 4–6 biological replicates/group. *P < 0.05, **P < 0.01, ***P < 0.001, ****P < 0.0001.

