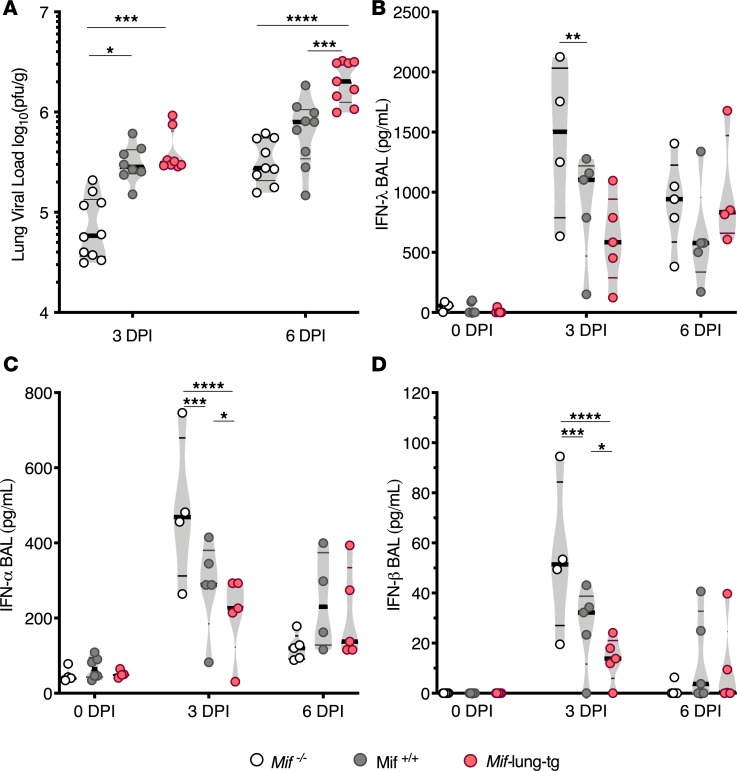
Figure 3. Mif expression correlates with higher viral load after infection and lower levels of IFNs.
(A) Quantification of viral load in lungs of mice at 3 and 6 DPI. IFN proteins in BAL by ELISA: (B) IFN-λ, (C) IFN-α, and (D) IFN-β. Statistical differences were determined by 2-way or 1-way ANOVA followed by Tukey multiple comparisons test. The violin plots are closed curves representing data distribution and encapsulate the median, range, and interquartilerange, with each symbol representing a biological replicate. Data are representative of pooled samples from 2 independent experiments, with total n = 7–8 biological replicates/group (A), or representative of 2 independent experiments, with n = 4–5 biological replicates/group (B–D). *P < 0.05, **P < 0.01, ***P < 0.001, ****P < 0.0001.

