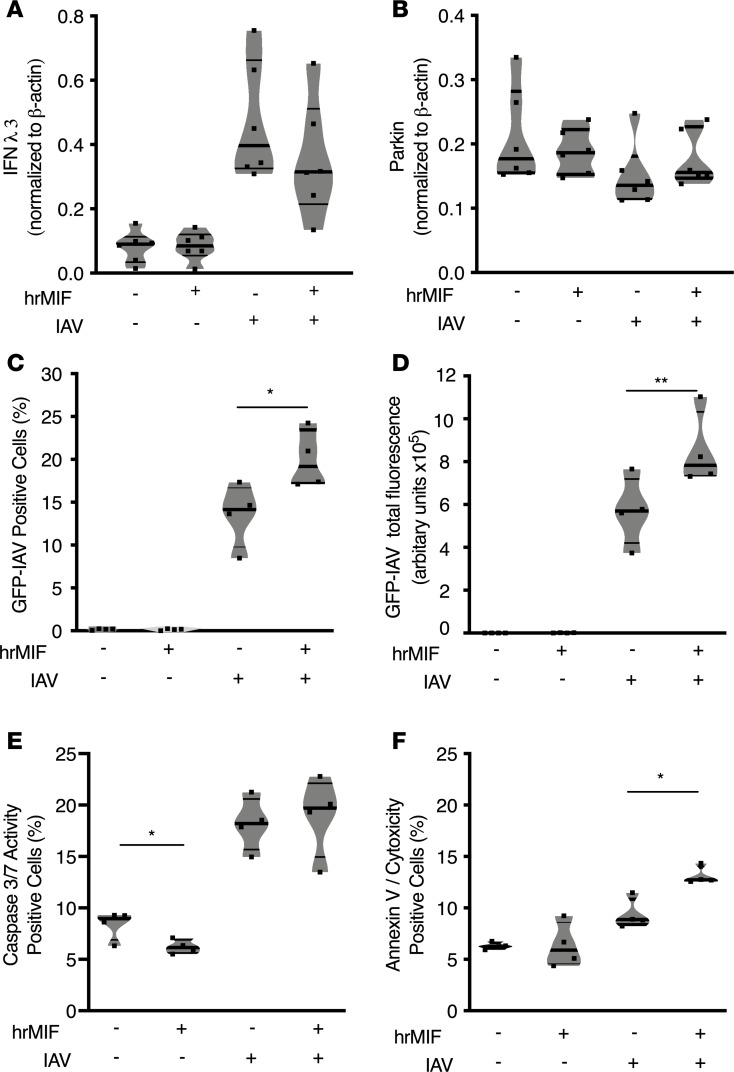
Figure 6. MIF promotes spread of IAV infection in Calu-3 cells.
Measurements from Calu-3 cells at 24 hours after either PR8 IAV MOI 1 infection or mock infection: (A) IFN-λ3 in cell lysate by Western blot, (B) parkin in cell lysate by Western blot, (C) green fluorescent protein IAV–positive (GFP-IAV–positive) cells, (D) total GFP-IAV fluorescence, (E) cellular apoptosis initiation measured by caspase-3/7 activity, and (F) cells displaying necrotic/late apoptotic features, as measured by double positivity with annexin V and cytotoxicity dyes. Statistical differences were determined by unpaired 2-tailed Student’s t test (A–C). The violin plots are closed curves representing data distribution and encapsulate the median, range, and interquartilerange, with each symbol representing a biological replicate. Data are representative of at least 2 independent experiments with n = 6 biological replicates/group (A and B) or n = 4 biological replicates/group (C–F). *P < 0.05, **P < 0.01. Statistical differences were determined by unpaired 2-tailed Student’s t test.

