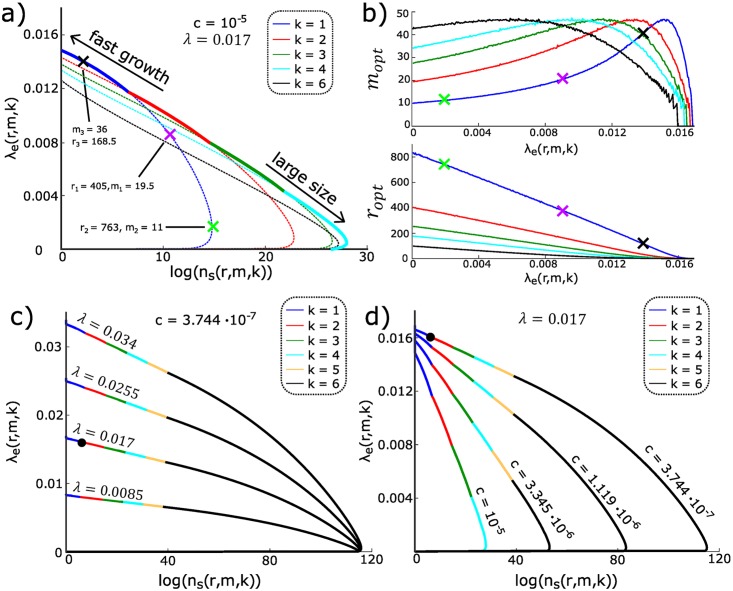
Fig 4. Optimal tradeoffs in the presence of phages.
For all panels, we set NS = 599, NV = 5, and λ = 0.017 min−1 in line with the strain used in [26] carrying the EcoRI system, and without loss of generality we fix l/ρv = 1min such that ns and λe/pV are the same up to units. Note that for these results, we used a biologically realistic number of restrictions sites on the bacterial DNA as opposed to the small value of NS that was used for illustration purposes earlier in the paper. (a) Pareto front (thick line) for expected growth until phage escape, ns(r, m, k), and effective growth rate, λe (r, m, k), traced out by varying m, r, and the number of RM systems, k (different colors; dotted lines show individual Pareto fronts at fixed k); c = cr = cm = 10−5. Examples with specific parameter values are marked on k = 1 front with crosses. (b) Optimal enzyme activities, ropt and mopt (in min−1), on Pareto fronts for different k (color as in a), as a function of effective growth rate, λe. (c) Pareto fronts for different replication rates, λ, and cost c = cr = cm ≈ 3.7 · 10−7 chosen to make E. coli in [26] lie on the front (black dot, also in panel d); only k ≤ 6 are considered. (d) Pareto fronts for different cost c = cr = cm at fixed λ = 0.017 min−1.

