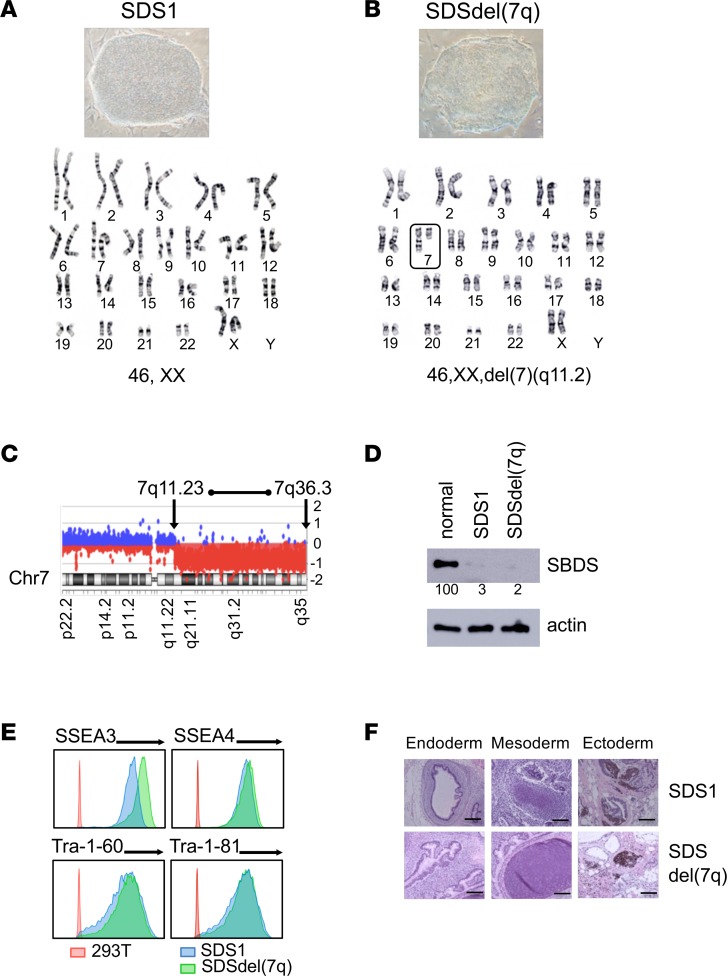
Figure 1. Generation of SDS iPSCs and SDSdel(7q) iPSCs.
(A and B) Representative iPSC colony morphology and karyotype for SDS patient–derived iPSCs (SDS1.5) before (A) and after (B) deletion of the long arm of chromosome 7 (box) (SDS1.5D5Cre4). Karyotype analysis was performed for all iPSC lines. (C) aCGH analysis showing deletion of the chromosome 7 region between bands q11.23 and q36.3 in 1 allele. (D) Western blot analysis of SBDS protein expression in SDS1 (SDS1.5) iPSCs and SDSdel(7q) (SDS1.5D5Cre4.9#9) iPSCs compared with normal (niPS) iPSC. Actin is shown as a loading control. Numbers below the bands indicate average densitometry quantitation of the SBDS band normalized to normal control sample value. (E) Flow cytometry of pluripotency surface markers SSEA3, SSEA4, Tra-1-60, and Tra-1-81 in SDS1 iPSCs (shown in blue, SDS1.2), SDSdel(7q) iPSCs (green, SDS1.5D5Cre4.9#2), and nonpluripotent cell line (red, HEK293T). (F) The indicated iPSCs were injected into immunodeficient mice. Histology of representative teratomas derived from SDS1 (SDS1.5) iPSCs and SDSdel(7q) (SDS1.5D5Cre4.9) iPSCs show differentiation into all 3 embryonic germ layers: endoderm (left), mesoderm (middle), and ectoderm (right). Scale bar: 100 μm.

