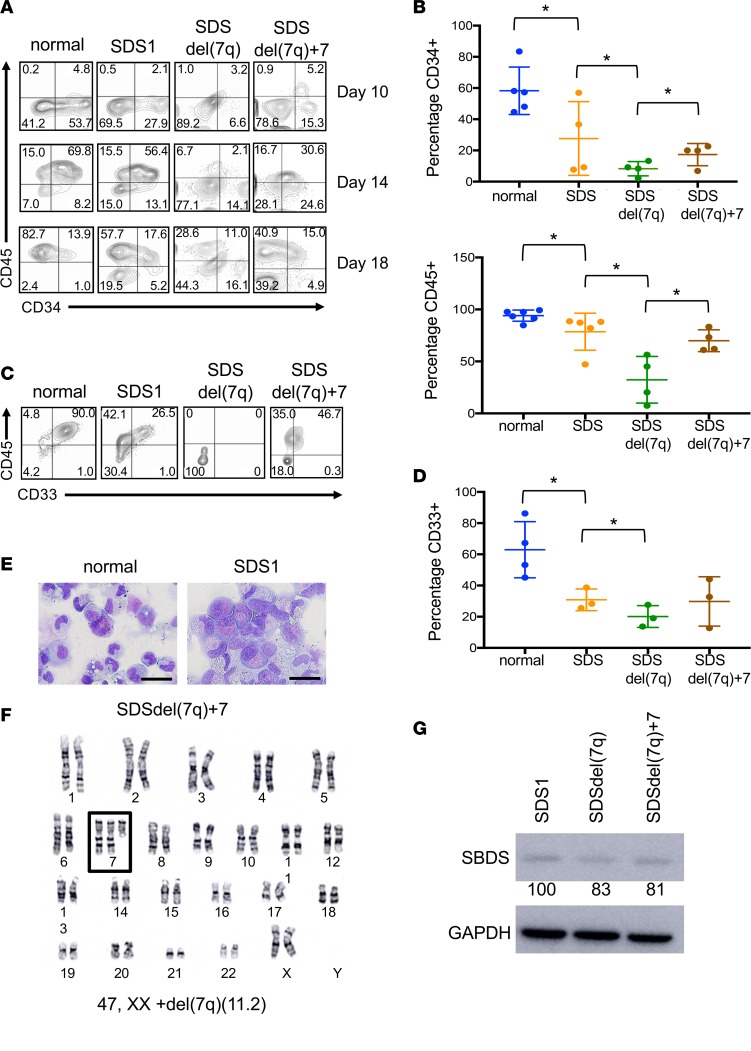
Figure 2. Effect of del(7q) on hematopoiesis of SDS iPSCs.
(A) iPSC-derived CD34+ and CD45+ cells at days 10, 14, and 18 of hematopoietic differentiation of normal, SDS1, SDSdel(7q), and SDSdel(7q)+7 iPSCs. (B) Graph summary of CD34 expression at day 10 of hematopoietic differentiation (top) and CD45 expression at day 18 of hematopoietic differentiation (bottom). Normal (N2.12 D1-1, 1157, n = 5), SDS (SDS1.5, SDS2.5, n = 4), SDSdel(7q) (SDS1.5D5Cre4.9#4, SDS1.5D5Cre4.9#9, n = 4), and SDSdel(7q)+7 (SDS1.5D5Cre4.9+7#1, SDS1.5D5Cre4.9+7#3, SDS1.5D5Cre4.9+7#4, n = 4). (C) iPSC-derived CD45+ and CD33+ cells at day 14 of myeloid differentiation for normal, SDS1, SDSdel(7q), and SDS del(7q)+7 iPSCs. (D) Comparative graph of percentage of CD33+ cells at day 14 of myeloid differentiation. Normal (N2.12 D1-1, 1157, n = 4), SDS (SDS1.5, SDS2.5, n = 3), SDSdel(7q) (SDS1.5D5Cre4.9#4, SDS1.5D5Cre4.9#9, n = 3), and SDSdel(7q)+7 (SDS1.5D5Cre4.9+7#3, SDS1.5D5Cre4.9+7#4, n = 3). For B and D, all results are represented as means ± SD. (E) Representative Wright-Giemsa stain of myeloid cells on day 7 of differentiation from normal (N2.12 D1-1, left) and SDS iPSCs (SDS1.5, right). Scale bar: 20 μm. (F) Representative karyotype of SDSdel(7q) iPSCs after spontaneous acquisition of additional chromosome 7 (box). (G) Western blot analysis of SBDS protein in SDS1 (SDS1.5), SDSdel(7q) (SDS1.5D5Cre4.9#2), and SDSdel(7q)+7 (SDS1.5D5Cre4.9+7#4) iPSCs. GAPDH is shown as a loading control. Numbers below the bands indicate average densitometry quantitation normalized to normal control sample values. *P < 0.05 by unpaired, 2-tailed Student’s t test.

