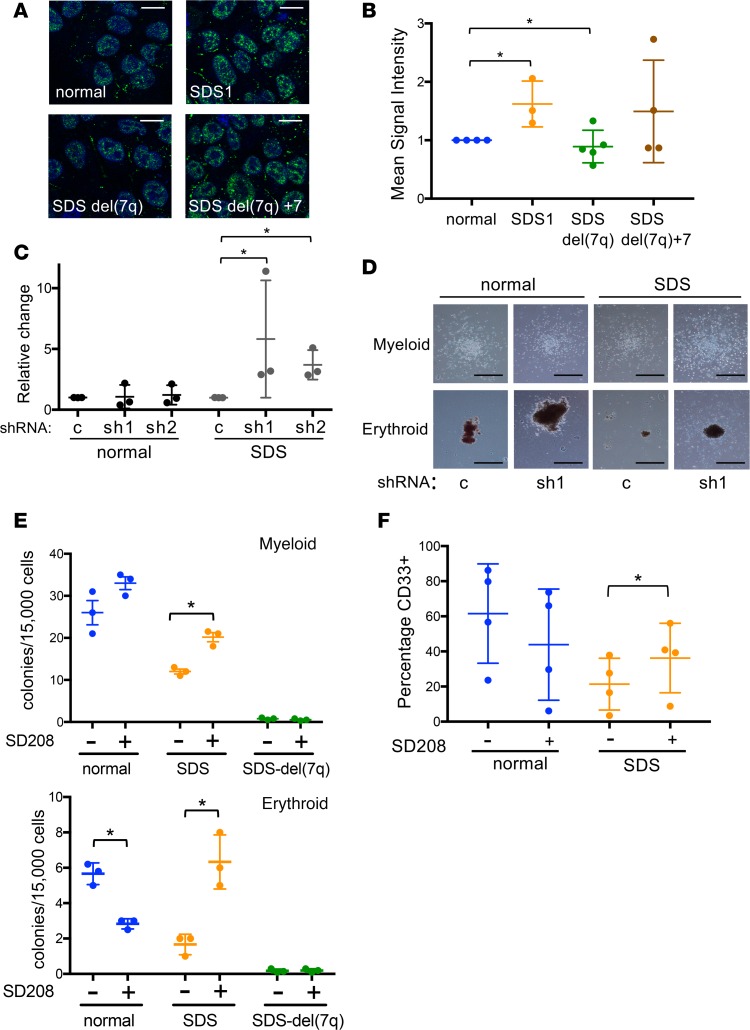
Figure 4. The TGF-β pathway is upregulated in SDS iPSCs and modulated following 7q deletion.
(A) Representative images of phospho-SMAD2 immunofluorescence (green) in normal, SDS1, SDSdel(7q), and SDSdel(7q)+7 iPSCs. Nuclei are stained with DAPI (blue). Scale bar: 10 μm. (B) Mean signal intensity for nuclear phospho-SMAD2 signal was quantified in individual cells (n = 100 cells/line/experiment) of normal (1157), SDS1 (SDS1.5), SDSdel(7q) (SDS1.5D5Cre4.9#9), and SDSdel(7q)+7 (SDS1.5D5Cre4.9+7#2) iPSCs. (C) Relative methylcellulose hematopoietic colony formation per 10,000 cells plated for normal or SDS primary marrow mononuclear cells following lentiviral transduction of the indicated shRNA: scrambled (c), SMAD3 shRNA 1 (sh1), and SMAD3 shRNA2 (sh2). Cells were plated in triplicate for each of 3 independent experiments (n = 3). (D) Representative images of myeloid (top) and erythroid (bottom) colonies from normal or SDS primary marrow with scrambled (c) versus SMAD3 shRNA (sh1). Scale bar: 1 mm. (E) Hematopoietic colony formation per 15,000 iPSC-derived cells plated in methylcellulose for normal (blue, N2.12 D1-1, n = 3), SDS (orange, SDS1.5, n = 3), and SDSdel(7q) (green, SDS1.5D5Cre4.9#9, n = 3) iPSCs in the presence or absence of 1 μM SD208. Mean ± SD are shown for myeloid (top) and erythroid (bottom) colonies. (F) CD33 expression at day 7 of myeloid differentiation showing means ± SD for normal (blue, N2.12 D1-1, n = 4) and SDS (orange, SDS1.5, n = 4) iPSCs. *P < 0.05 by unpaired, 2-tailed Student’s t test (B, C, E, and F).

