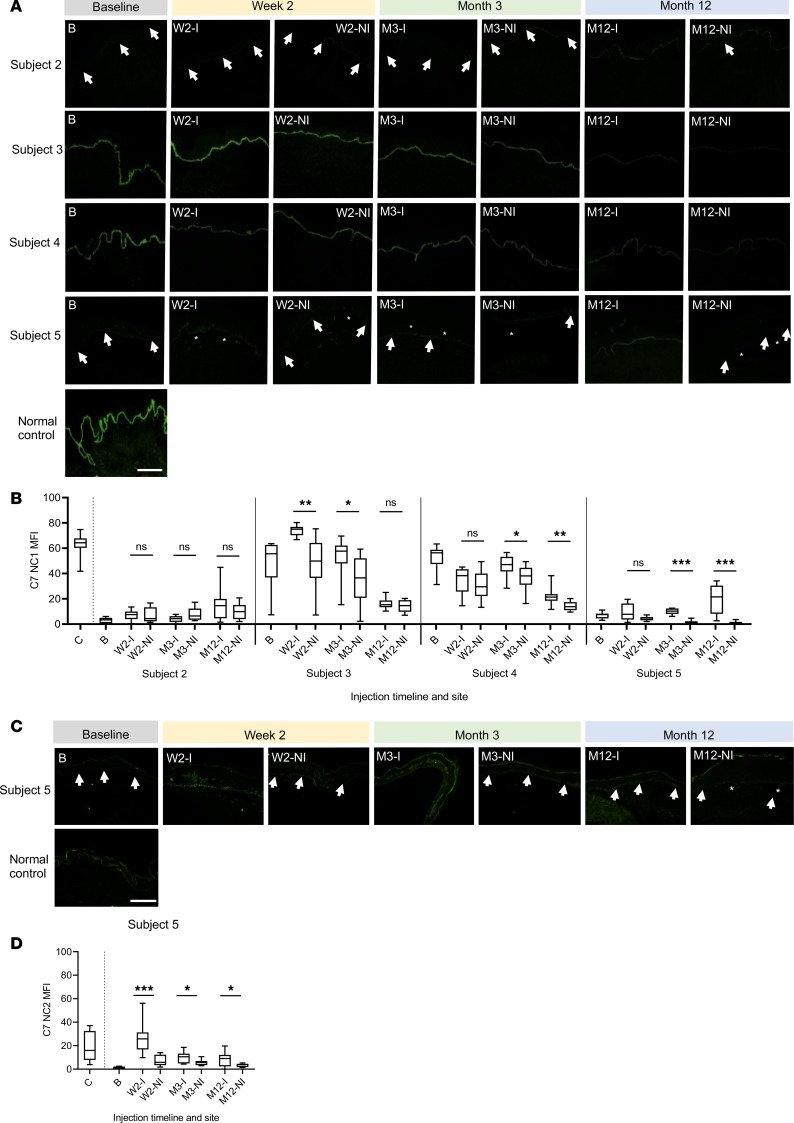
Figure 4. Type VII collagen (C7) expression in subjects 2–5 at baseline and in injected and noninjected skin at 2 weeks, 3 months, and 12 months.
(A) IF staining with a monoclonal LH7.2 antibody to C7 (targeting NC1 domain) on skin sections taken at specified time points from both injected (I) and noninjected (NI) sites alongside respective baseline samples. Trace C7 staining is visible in subjects 2 and 5, while brighter staining is seen in subjects 3 and 4. White arrows indicate the trace staining of C7 IF; asterisks indicate dermal-epidermal separation (B) The MFI of C7 NC1 expression along the DEJ in the injected and noninjected skin demonstrated in A for subjects 2–5 was further quantified for each sample in an assessor-blinded fashion using ImageJ, as adapted from a previous study (27). An average MFI value was calculated from 10 measurements taken at regular intervals using 8 × 8 pixels every 100 pixels along the DEJ. The C7 NCI MFI graphs in B correspond to the C7 IF images in A. (C) IF staining to demonstrate full-length C7 expression in subject 5 using a polyclonal antibody targeting the NC2 domain of C7 protein (ab198899; Abcam) after optimization. (D) The C7 NC2 MFI was then calculated using ImageJ as for the C7 NC1 MFI as described in B in an assessor-blinded fashion. The box-and-whisker plots in B and C represent the 10 repeat measurements of C7 MFI taken along the DEJ. *P < 0.05, **P < 0.005, ***P < 0.001. Error bars represent mean ± SEM. White arrows indicate C7 expression at the DEJ. B, baseline; C, control (normal skin); I, injected skin; M, month; NI, non-injected skin; W, week. Scale bars: 100 μm.

