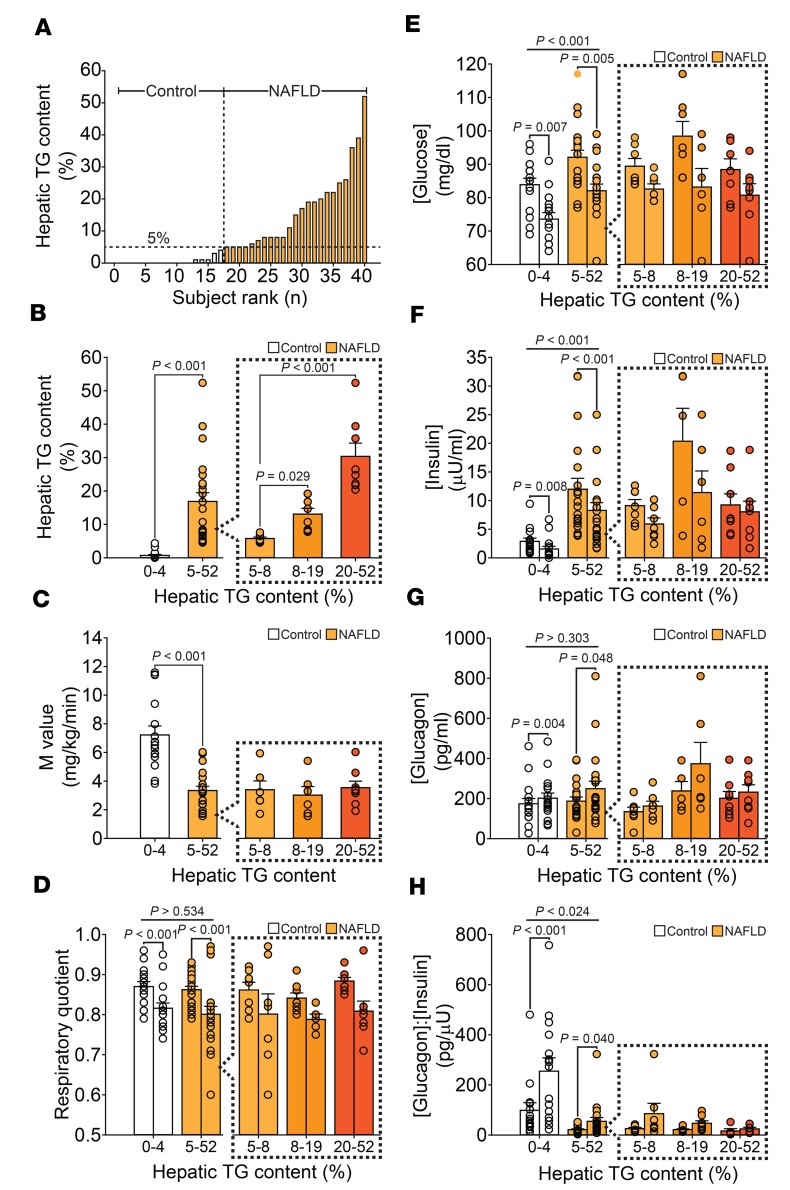
Figure 1. Hepatic TG content, insulin sensitivity, and biochemical response to a 24-hour fast.
(A) Hepatic TG content was measured by 1H-MRS and is shown by rank (range: 0%–52%; n = 40). (B) Using a hepatic TG cutoff of 5%, the population was dichotomized into control (n = 17) and NAFLD (n = 24) groups. The NAFLD group was further separated into tertiles of liver fat, with tertiles 1–3 having mean hepatic TG content of 6% ± 1% (n = 7), 13% ± 2% (n = 8), and 30% ± 4% (n = 8), respectively (P < 0.004). (C) Mean glucose disposal rates (M value) during H-E clamp were significantly lower in the NAFLD group (n = 20), consistent with insulin resistance. (D) Respiratory quotients were similar in control (n = 15) and NAFLD (n = 20) subjects and declined from 12 (left bars) to 24 hours (right bars) of fasting, consistent with fasting physiology. (E) Plasma glucose concentrations at 12 and 24 hours of fasting were higher in NAFLD subjects (n = 22) compared with controls (n = 16) and declined in both groups as the fasting duration increased. (F) Plasma insulin and (G) glucagon concentrations as well as (H) glucagon/insulin ratio at 12 and 24 hours of fasting are shown for control (n = 15) and NAFLD (n = 19) subjects. Fasting changes in concentrations of plasma insulin and glucagon, as well as the glucagon/insulin ratio, were observed in both groups; however, insulin was consistently higher, and glucagon/insulin ratio lower, among NAFLD subjects. Plasma concentrations of glucose, insulin, and glucagon were similar among the tertiles of liver fat. Significance was determined using 2-tailed Student’s t test for paired and unpaired data and 1-way ANOVA and 2-way repeated-measures ANOVA when appropriate.

