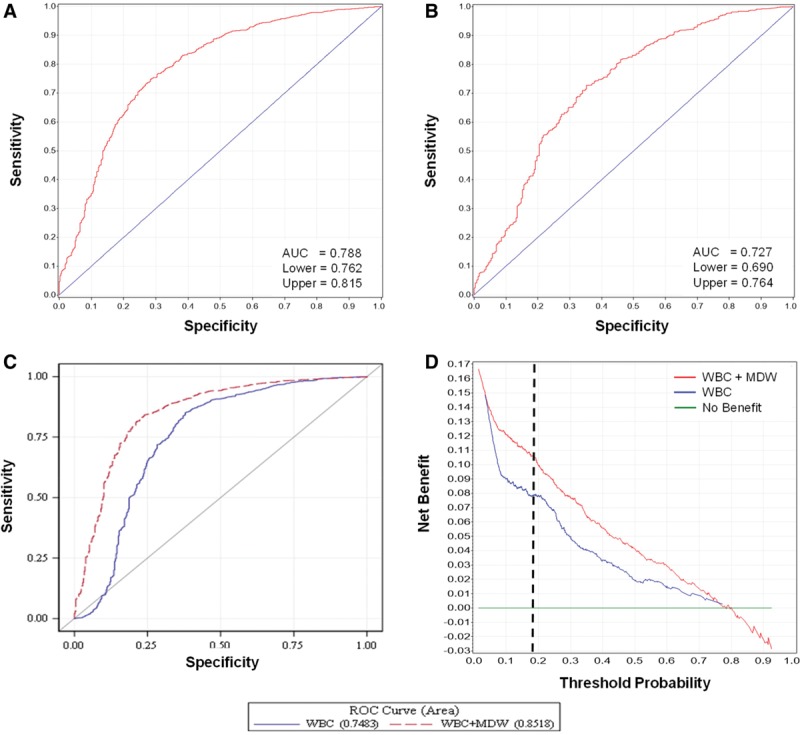
Figure 3.

Performance of monocyte distribution width (MDW) for Sepsis-2 and Sepsis-3 detection. Receiver operating characteristic (ROC) curves for MDW conforming to Sepsis-2 (A) and Sepsis-3 (B) criteria and comparing WBC alone and in combination with MDW for Sepsis-2 detection (C). D, A decision curve analysis plots the net benefits of WBC and MDW for sepsis detection compared with WBC alone. Note that the pretest (threshold) probability of sepsis in this cohort was 17.8%, and the added benefit prediction is reflected by the distance between the two plots measured at the black dotted line. AUC = area under the curve.
