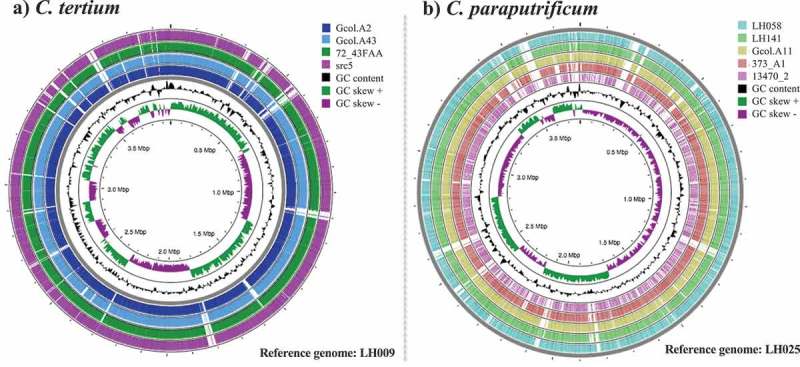
Figure 2.

Intra-taxa comparisons of the complete genome sequences for (a) C. tertium and (b) C. paraputrificum. Analyses were developed in the CGview server [57]. The genome with the biggest size was selected as the reference for each species. Regions in white correspond to variable areas between genomes. Colors were assigned to the outer rings when sequences were found that each had a BLAST identity cutoff of 0.6, for the pairwise comparisons against the “reference genome”.
