
Figure 1.
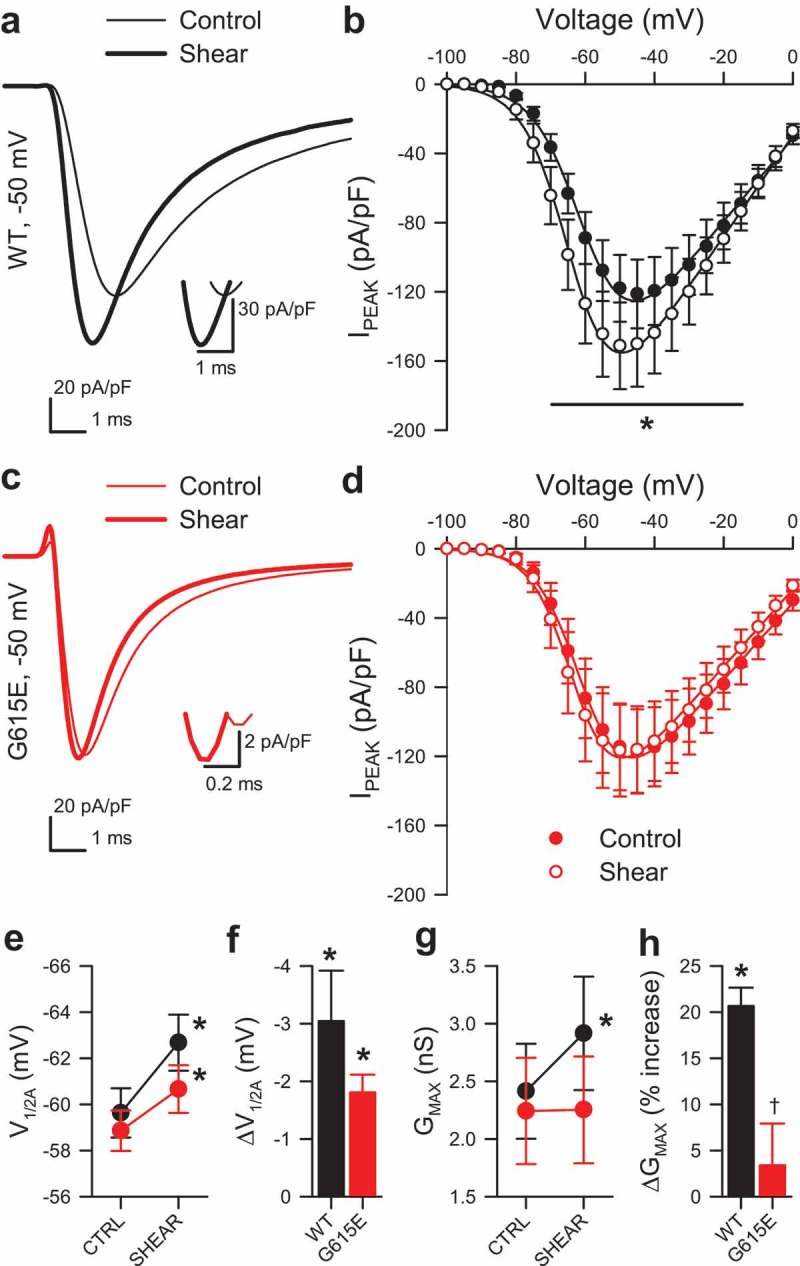
Shear sensitivity of voltage-gating of G615E NaV1.5 compared to WT NaV1.5. (a, c), Na+ current traces from wild-type (WT, a) or G615E (c) NaV1.5 channels elicited by a voltage step from −120 to −50 mV, before (–) or during shear stress (▬) by flow of extracellular solution at 10 mL/min. Insets show the current traces at peak. (b,d), Normalized peak current densities (IPEAK) of WT (b) or G615E (d) Na+ currents before (●) or during (○) shear stress. (e-f), Voltage of half-activation (V1/2A) during control or shear stress (e) and the average shift in V1/2A with shear (f, ΔV1/2A) for WT (black) and G615E (red). (g-h), Peak conductance (GMAX) during control or shear stress (g) and the average change in GMAX with shear (h, ΔGMAX) for WT (black) or G615E (red). (b,d,e,g), n = 12 cells each, *P < 0.05 shear vs. control and P < 0.05 interaction between genotype and shear by a three-way ANOVA with Tukey post-test. (f,h), n = 12 cells each, *P < 0.05% to 0% by a two-tailed one-sample t-test; †P< 0.05 to WT by a two-tailed unpaired t-test.