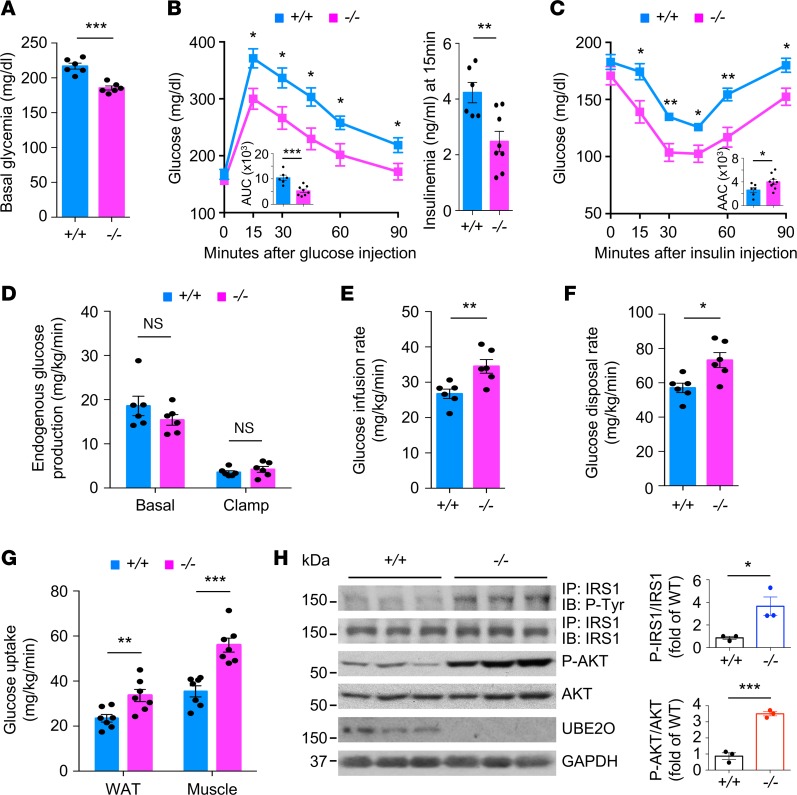
Figure 3. Ube2o–/– mice show improved insulin sensitivity in diet-induced type 2 diabetes mouse model.
(A) Blood glucose was measured Ube2o+/+ and Ube2o–/– mice on an HFD for 21 weeks. n = 6. (B and C) Glucose (GTT) (B) and insulin (ITT) (C) tolerance tests in Ube2o+/+ and Ube2o–/– mice on HFD for 21~22 weeks. Insets indicate AUC (B) and area above the curve (AAC) (C). Insulinemia at 15 minutes after the injection of glucose during a GTT test is shown in the right panel (B). Ube2o+/+ n = 6, Ube2o–/– n = 9. (D–F) Rates of basal and clamp endogenous glucose production (D), glucose infusion (E), and glucose disposal rate (F) during a hyperinsulinemic-euglycemic clamp study in Ube2o+/+ and Ube2o–/– mice. n = 6. (G) Insulin-stimulated 14C-2-deoxyglucose uptake was assessed in visceral WAT and gastrocnemius muscle of Ube2o+/+ and Ube2o–/– mice during the final 45 minutes of the hyperinsulinemic-euglycemic clamps. n = 7. (H) Immunoblots (left) and statistical data (right) showing insulin-induced (200 nM) tyrosine phosphorylation of IRS1 immunoprecipitates and S473 phosphorylation of AKT protein and their total protein levels in the extensor digitorum longus muscle from Ube2o+/+ and Ube2o–/– mice on an HFD. n = 3. Error bars represent ± =SEM. P value was determined by Student’s t test (*P < 0.05, **P < 0.01, ***P < 0.001).

