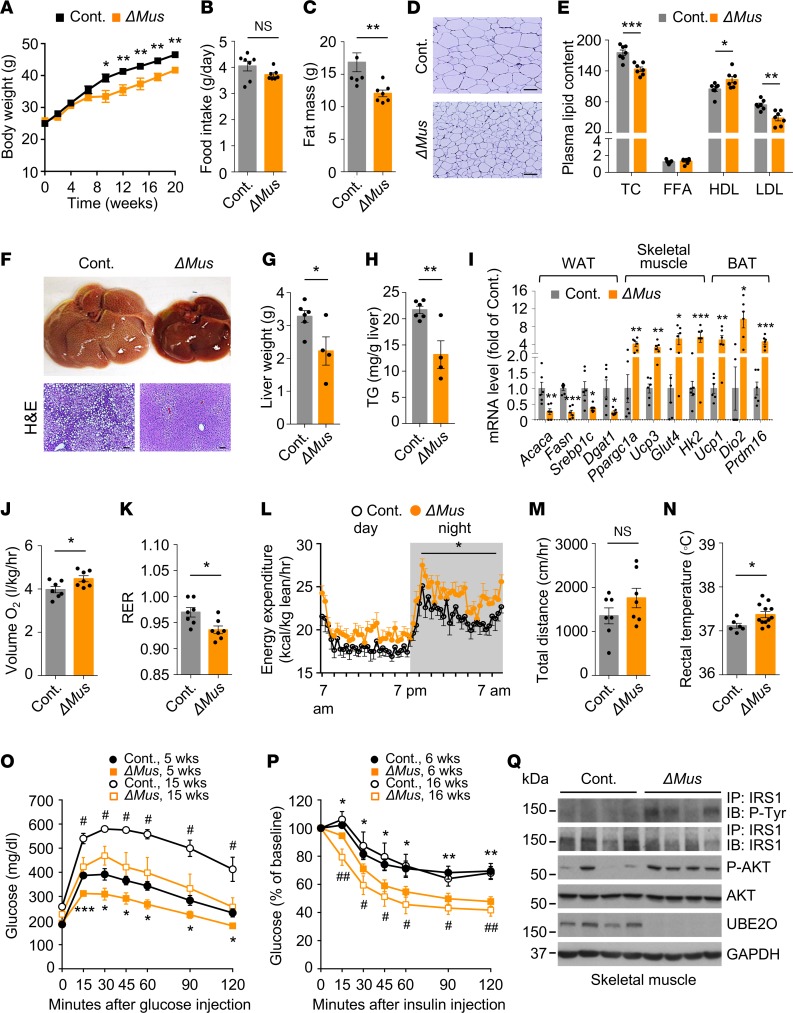
Figure 4. Muscle-specific ablation of Ube2o blocks diet-induced insulin resistance and metabolic disorders.
(A) Body weights of control (Ube2ofl/fl) and Ube2oΔMus mice fed an HFD for 20 weeks. Ube2ofl/fl n = 12, Ube2oΔMus n = 8. (B) Food intake (grams per day) in control and Ube2oΔMus mice on an HFD for 16 weeks. n = 7. (C) Fat mass of control and Ube2oΔMus mice on HFD for 20 weeks. n = 7. (D) H&E-stained sections of subcutaneous adipose tissue in control and Ube2oΔMus mice on an HFD for 20 weeks. Scale bars: 75 μm. (E) Plasma levels of TC (mg/dL), FFA (mEq/L), HDL (mg/dL), and LDL (mg/dL) in control and Ube2oΔMus mice on an HFD for 20 weeks. n = 7. (F) Photographs and H&E-stained sections of liver in control and Ube2oΔMus mice on an HFD for 20 weeks. Scale bars: 75 μm. (G) Liver weight of control and Ube2oΔMus mice on an HFD for 20 weeks. Ube2ofl/fl n = 6, Ube2oΔMus n = 4. (H) Hepatic TG level per gram of liver in control and Ube2oΔMus mice on an HFD for 20 weeks. Ube2ofl/fl n = 6, Ube2oΔMus n = 4. (I) Total RNAs from WAT, skeletal muscle, and BAT of control and Ube2oΔMus mice on an HFD for 20 weeks were subjected to RT-qPCR. n = 6. (J) VO2 per kg of lean mass in control and Ube2oΔMus mice was determined in metabolic chambers. n = 7. (K) RER (VCO2/VO2) of control and Ube2oΔMus mice was determined in metabolic chambers. n = 7. (L) Energy expenditure during day and night per kg of lean mass of control and Ube2oΔMus mice was determined in metabolic chambers. n = 7. (M) Home cage locomotor activity during both the light and dark phases of control and Ube2oΔMus mice was determined by using an automated combined indirect calorimetry system. n = 7. (N) Rectal temperature of control and Ube2oΔMus mice on an HFD for 12 weeks. Ube2ofl/fl n = 6, Ube2oΔMus n = 12. GTTs (O) and ITTs (P) in control and Ube2oΔMus mice on an HFD for the indicated time periods. n = 7. *P < 0.05, **P < 0.01, ***P < 0.001, control 5 and 6 weeks HFD vs. Ube2oΔMus 5 and 6 weeks HFD; #P < 0.05, ##P < 0.01, control 15 and 16 weeks HFD vs. Ube2oΔMus 15 and 16 weeks HFD. (Q) Immunoblots showing insulin-induced (200 nM) tyrosine phosphorylation of IRS1 immunoprecipitates and S473 phosphorylation of AKT protein and their total protein levels in the extensor digitorum longus muscle from control and Ube2oΔMus mice on an HFD for 6 weeks. Error bars represent ±SEM. P value was determined by Student’s t test (*P < 0.05, **P < 0.01, ***P < 0.001).

