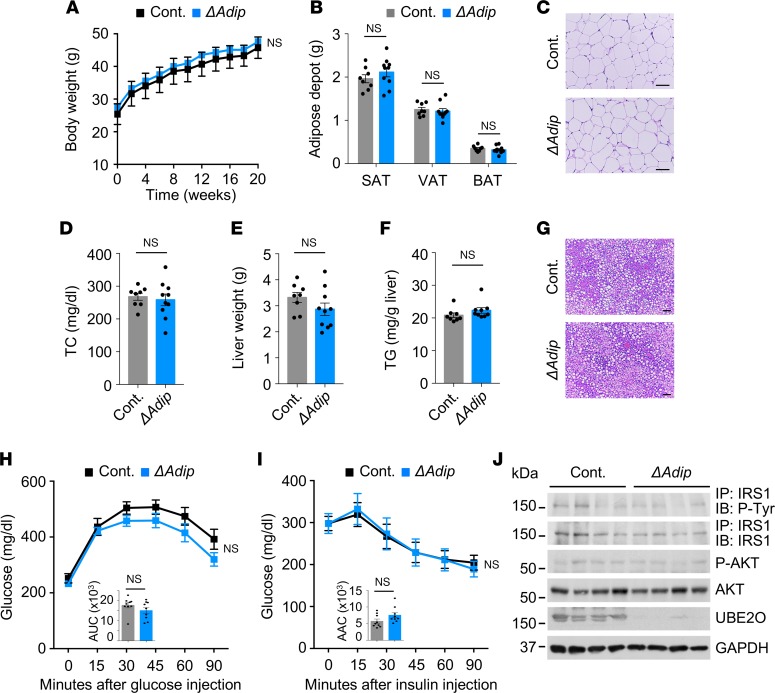
Figure 5. Adipose tissue–specific Ube2o-knockout mice do not have improved fat metabolism on an HFD.
(A) Body weights of control (Ube2ofl/fl) and Ube2oΔAdip mice fed an HFD for 20 weeks. n = 10. (B) Adipose depot weight of control and Ube2oΔAdip mice on an HFD for 20 weeks. SAT, subcutaneous adipose tissue; VAT, visceral adipose tissue; BAT, brown adipose tissue. Ube2ofl/fl n = 8, Ube2oΔAdip n = 10. (C) H&E-stained sections of SAT in control and Ube2oΔAdip mice on an HFD for 20 weeks. Scale bars: 75 μm. (D) Plasma levels of TC (mg/dL) in control and Ube2oΔAdip mice on an HFD for 20 weeks. Ube2ofl/fl n = 8, Ube2oΔAdip n = 10. (E) Liver weight of control and Ube2oΔAdip mice on an HFD for 20 weeks. Ube2ofl/fl n = 8, Ube2oΔAdip n = 10. (F) Hepatic TG level per gram of liver in control and Ube2oΔAdip mice on an HFD for 20 weeks. Ube2ofl/fl n = 8, Ube2oΔAdip n = 9. (G) H&E-stained sections of liver in control and Ube2oΔAdip mice on an HFD for 20 weeks. Scale bars: 75 μm. GTTs (H) and ITTs (I) in control and Ube2oΔAdip mice on an HFD for 16 weeks. Insets indicate AUC (H) and AAC (I). n = 9. (J) Immunoblots showing insulin-induced (200 nM) tyrosine phosphorylation of IRS1 immunoprecipitates and S473 phosphorylation of AKT protein and their total protein levels in VAT from control and Ube2oΔAdip mice on an HFD for 20 weeks. Error bars represent ±SEM. P value was determined by Student’s t test.

