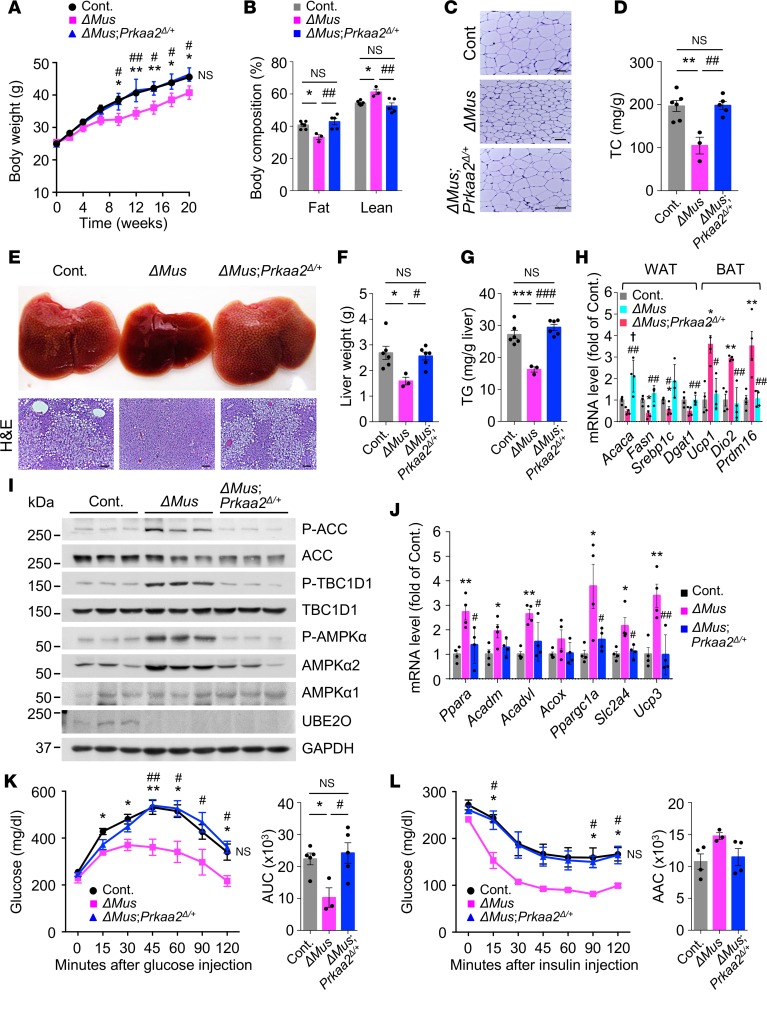
Figure 7. Activation of skeletal muscle AMPKα2 drives the protective effects of UBE2O loss on diabetes and metabolic disorders.
(A) Body weights of control (Ube2ofl/fl), Ube2oΔMus, and ΔMus;Prkaa2Δ/+ mice fed an HFD for 20 weeks. Ube2ofl/fl n = 13, Ube2oΔMus n = 7, ΔMus;Prkaa2Δ/+ n = 7. (B) Percentage of fat and lean mass of control, Ube2oΔMus, and ΔMus;Prkaa2Δ/+ mice on an HFD for 16 weeks was determined by EchoMRI. Ube2ofl/fl n = 6, Ube2oΔMus n = 3, ΔMus;Prkaa2Δ/+ n = 5. (C) H&E-stained sections of SAT in control, Ube2oΔMus, and ΔMus;Prkaa2Δ/+ mice on an HFD for 20 weeks. Scale bars: 75 μm. (D) Plasma levels of TC (mg/dL) in control, Ube2oΔMus, and ΔMus;Prkaa2Δ/+ mice on an HFD for 20 weeks. Ube2ofl/fl n = 5, Ube2oΔMus n = 3, ΔMus;Prkaa2Δ/+ n = 5. (E) Photographs and H&E-stained sections of liver in control, Ube2oΔMus, and ΔMus;Prkaa2Δ/+ mice on an HFD for 20 weeks. Scale bars: 75 μm. (F) Liver weight of control, Ube2oΔMus, and ΔMus;Prkaa2Δ/+ mice on an HFD for 20 weeks. Ube2ofl/fl n = 6, Ube2oΔMus n = 3, ΔMus;Prkaa2Δ/+ n = 6. (G) Hepatic TG level per g of liver of control, Ube2oΔMus and ΔMus;Prkaa2Δ/+ mice on HFD for 20 weeks. Ube2ofl/fl n = 6, Ube2oΔMus n = 3, ΔMus;Prkaa2Δ/+ n = 6. (H) Total RNAs from WAT and BAT of control, Ube2oΔMus, and ΔMus;Prkaa2Δ/+ mice on an HFD for 20 weeks were subjected to RT-qPCR. n = 4. (I) Lysates from skeletal muscle of control, Ube2oΔMus, and ΔMus;Prkaa2Δ/+ mice on an HFD for 20 weeks were subjected to immunoblotting for the indicated proteins. (J) Total RNAs from skeletal muscle of control, Ube2oΔMus, and ΔMus;Prkaa2Δ/+ mice on an HFD for 20 weeks were subjected to RT-qPCR. n = 4. GTTs (K) and ITTs (L) in control, Ube2oΔMus, and ΔMus;Prkaa2Δ/+ mice on an HFD for 9 and 10 weeks, respectively. AUC (K) and AAC (L) are shown in the right panels. Ube2ofl/fl n = 5, Ube2oΔMus n = 3, ΔMus;Prkaa2Δ/+ n = 5. Error bars represent ±SEM. P value was determined by ANOVA. *P < 0.05, **P < 0.01, ***P < 0.001, Ube2ofl/fl vs. Ube2oΔMus; #P < 0.05, ##P < 0.01, ###P < 0.001, Ube2oΔMus vs. ΔMus;Prkaa2Δ/+; †P < 0.05, Ube2ofl/fl vs. ΔMus;Prkaa2Δ/+.

