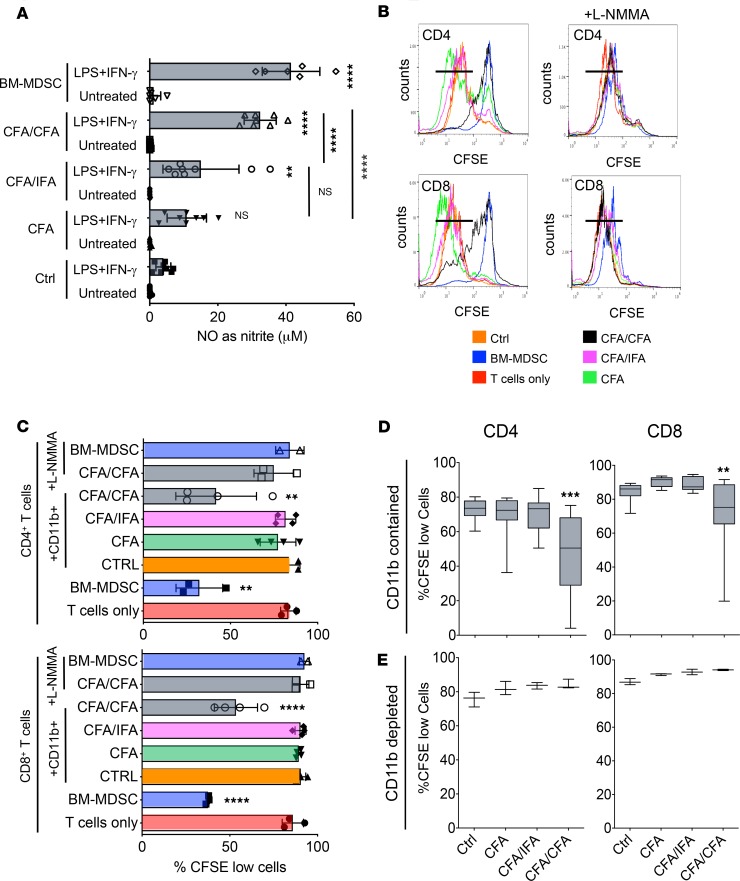
Figure 2. Only CD11b+ cells isolated from CFA/CFA mice produce substantial amounts of NO and suppress T cell proliferation.
(A) CD11b+ cells from spleen cells of untreated (Ctrl) and CFA-, CFA/IFA-, and CFA/CFA-treated mice were isolated by MACS and compared with in vitro–generated BM-MDSCs for their NO production by Griess assay after overnight stimulation with LPS/IFN-γ. Values correspond to NO production by 2 × 10⁶ cells (3 independent experiments with n = 8 replicates, except BM-MDSCs with n = 6). (B) T cell suppression assays. CFSE-labeled bulk T cells isolated from naive mice were stimulated with CD3/CD28 antibodies and cultured for 4 days with MACS-purified CD11b+ cells from untreated and CFA-, CFA/IFA-, and CFA/CFA-treated mice or in vitro BM-generated MDSCs in the presence or absence of L-NMMA. Example assay showing the gating for proliferated CFSElo cells. (C) Pooled data of individual experiments, as shown in B, are displayed. For T cells only, BM-MDSC, CFA/CFA plus L-NMMA (n = 3). For CTRL, CFA, CFA/IFA, CFA/CFA (n = 4). For BM-MDSC plus L-NMMA (n = 2). (D) Ex vivo bulk T cell proliferation assay. Spleens from untreated (Ctrl, n = 14 mice), CFA- (n = 16), CFA/IFA- (n = 15), and CFA/CFA-treated mice (n = 16) were CFSE labeled and then stimulated with CD3/CD28 antibodies for 4 days. The percentages of proliferated CFSElo cells within the CD4+ and CD8+ T subsets are shown. (E) Ex vivo bulk T cell proliferation assay. CD11b+ cell–depleted spleens from untreated and CFA-, CFA/IFA-, and CFA/CFA-treated mice (n = 3) were CFSE labeled and then stimulated with CD3/CD28 antibodies for 4 days. The percentages of proliferated CFSElo cells within the CD4+ and CD8+ T subsets are shown. Statistical significance was assessed by comparison of sorted cells from control versus treated mice (A) or T cells only versus T cells cocultured with ex vivo–sorted CD11b+ cells from treated mice (C) or bulk splenic T cells from control versus treated mice (D and E). Statistics by 1-way ANOVA with multiple comparisons and Tukey’s post test. **P < 0.01,****P < 0.0001.

