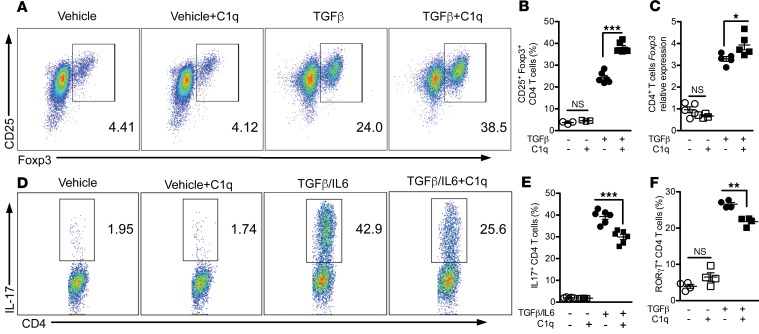
Figure 3. C1q enhances Tregs while it inhibits Th17 cell differentiation in vitro.
Mouse CD4+ T cells were isolated from splenocytes by autoMACS. (A) Representative flow plot of CD4+ T cells isolated from the spleen and stimulated with anti-CD3/anti-CD28; cells were differentiated under Treg condition (TGF-β, anti–IL-4, anti–IFN-γ) with or without C1q for 3 days; CD4+ T cells in vehicle control condition were stimulated with anti-CD3/anti-CD28 but received PBS for 3 days. Tregs in culture were identified by flow cytometry using CD25 and Foxp3 markers. (B) Cumulative data shown in A were summarized (n = 3 for control and C1q; n = 6 for TGF-β and TGF-β + C1q). Results are represented as mean ± SEM, from 3 independent experiments. (C) Expression of Foxp3 mRNA in culture described in A was measured by qPCR (n = 5 in each group, normalized to 18S expression). Results are represented as mean ± SEM, from 3 independent experiments. (D) Representative CD4+ T cells differentiated under Th17 condition (e.g., IL-6, TGF-β, anti–IL-4, anti–IFN-γ) for 3 days. IL-17 production was measured using intracytoplasmic cytokine staining. (E) Cumulative data shown in (D) is summarized (n = 6 for control and C1q; n = 6 for TGF-β and TGF-β + C1q). (F) CD4+ T cells expressing RoRγt in culture described in D were measured by qPCR (n = 4 in each group, normalized to 18S expression). Results are represented as mean ± SEM, from 3 independent experiments. *P < 0.05, **P < 0.01, ***P < 0.001; P values were determined by 1-way ANOVA test with Bonferroni’s correction for multiple comparisons.

