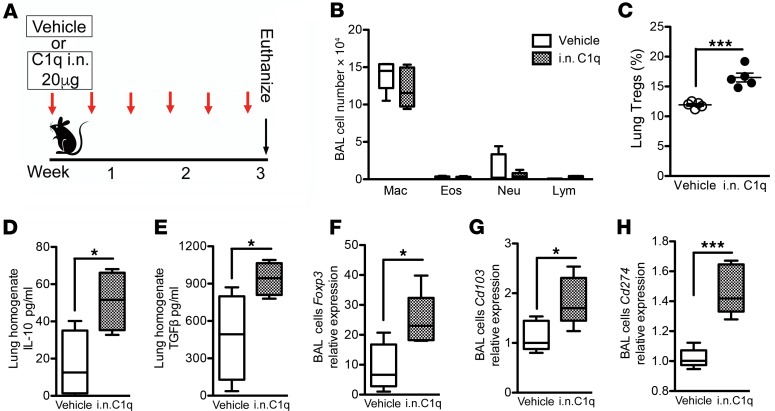
Figure 4. Intranasal C1q induces Tregs in lungs of WT mice.
Eight-week-old WT (C57BL/6J) mice were treated with intranasal (i.n.) C1q (20 μg, twice per week) for 3 weeks. (A) Schematic representation of C1q treatment in naive mice. (B) Bronchoalveolar lavage (BAL) fluid analyses from the C1q-treated or vehicle-treated mice showing a similar number of macrophages (Mac), eosinophil (Eos) lymphocytes (Lym), and neutrophils (Neu). n = 5 in each group. Box, median and interquartile range; whiskers: min to max range. (C) Cumulative flow cytometry analysis showed the population of CD25+Foxp3+ CD4 T cells in lungs of the same group of mice. ***P < 0.001, as determined by the Student’s t test. n = 5 in each group. Results are represented as mean ± SEM, from 2 independent experiments. Concentrations of IL-10 (D) and TGF-β (E) in lung homogenate were measured by ELISA. *P < 0.05, as determined by the Student’s t test. n = 5 in each group. Results are represented as mean ± SEM, from 2 independent experiments. Expression of Foxp3 (F), Cd103 (G), and Cd274 (PD-L1) (H) in BAL cells was measured using quantitative reverse transcription PCR (qPCR). n = 5 in each group. Results are represented as mean ± SEM, from 2 independent experiments. *P < 0.05, ***P < 0.001, as determined by the Student’s t test.

