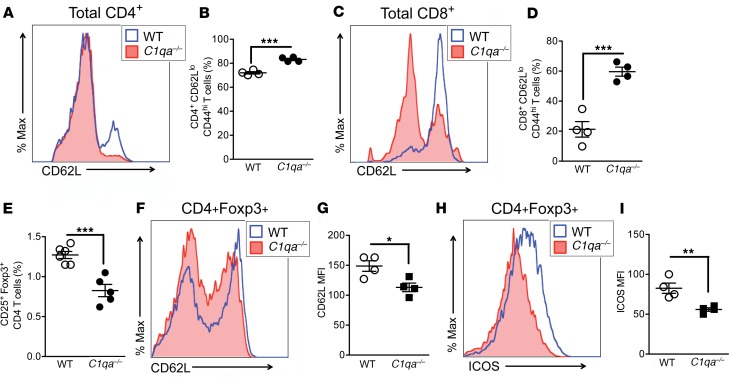
Figure 5. Increased T cell activation in C1qa–/– mice.
Total splenocytes were isolated from 12-month-old WT or C1qa–/– mice. Representative histograms and summarized mean fluorescence intensity of CD62L on CD4+ (A and B) and CD8+ (C and D) T cells as measured by flow cytometry. n = 4 in each group. Results are represented as mean ± SEM, from 2 independent experiments. ***P < 0.001 was determined by Student’s t test. (E) Relative abundance of CD25+Foxp3+ CD4+ T cell population in the spleen was measured by flow cytometry. n = 6 in WT and n = 5 in C1qa–/– group. Results are represented as mean ± SEM, from 2 independent experiments. ***P < 0.001 was determined by Student’s t test. Representative histogram and summarized the mean fluorescent intensity of CD62L (F and G) and ICOS (H and I) on CD4+ Foxp3+ T cells in the spleen. n = 4 in each group. Results are represented as mean ± SEM, from 2 independent experiments. **P < 0.01 was determined by Student’s t test.

