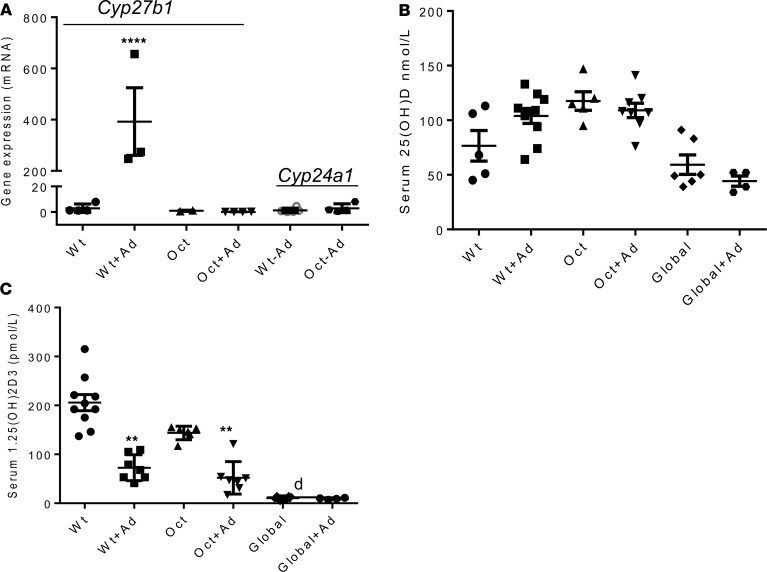
Figure 2. mRNA levels of bone Cyp27b1 (encoding 1α(OH)ase activity) and Cyp24a1(encoding 24(OH)ase activity) and serum levels of 25(OH)D and 1,25(OH)2D.
Total RNA was extracted from bone marrow–flushed femurs and mRNA levels of bone Cyp27b1 and Cyp24a1 were determined by RT-PCR and normalized to Gapdh mRNA (A). Data are the mean ± SEM of at least 3 independent experiments, n = 3–6/experiment. ****P < 0.0001 in adenine-treated WT mice compared with WT mice on a regular diet, determined by Student’s t test. Serum levels of 25(OH)D and (C) serum levels of 1,25(OH)2D, as determined by ELISA, in WT mice, osteocyte-specific 1αOHase–/– KO mice (Oct), and global 1αOHase–/– KO mice (Global). (B). “Ad” indicates treatment with adenine. Global 1αOHase–/– KO mice remained on a high calcium diet during the course of the experiments. “d” represents the detection limit of the assay for 1,25(OH)2D. Data are the mean ± SEM (n = 6–8 mice of each genotype). **P ≤ 0.01 compared with mice of the same genotype on a non-adenine–containing diet, determined by ANOVA with Bonferroni multiple comparison test.

