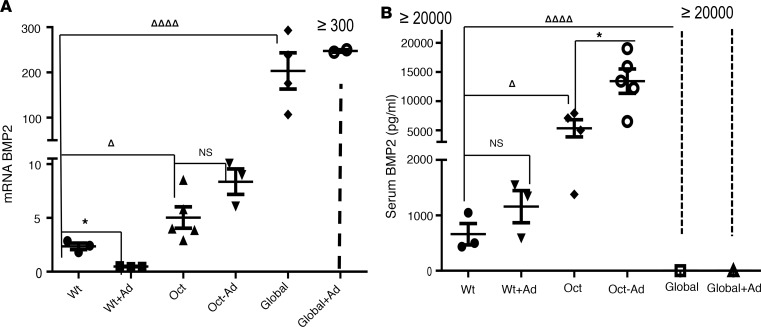
Figure 4. Bone BMP2 expression by RT-PCR and serum BMP2 levels.
BMP2 mRNA expression in bone (A). Total RNA was extracted from bone marrow–flushed femurs 13 weeks of age and mRNA levels of BMP2 were determined by RT-PCR. Data are expressed as mean ± SEM, of 3–6 determinations normalized to Gapdh mRNA. ◊◊◊◊P ≤ 0.0001, ◊P ≤ 0.05 compared with WT mice not treated with adenine or to mice of the same genotype on a non-adenine–containing diet *P ≤ 0.05, determined by ANOVA with Bonferroni adjustment. Serum BMP2 levels at 13 weeks of age in mice of the indicated genotype (B). Data are expressed as mean ± SEM, (n = 3–6 mice of each genotype) compared with mice of the same genotype on a non-adenine–containing diet *P ≤ 0.01 or compared to Wt mice ◊◊◊◊P ≤ 0.0001, ◊P ≤ 0.05 by ANOVA with Bonferroni adjustment

