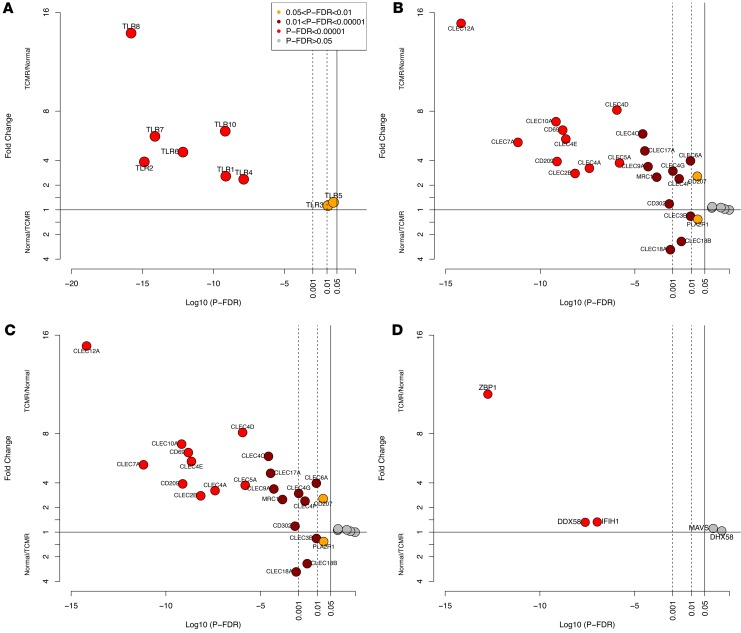
Figure 1. Differential intragraft abundance of mRNAs encoding transmembrane and cytosolic PRRs in human kidney allografts.
On the y axis, a fold change value of 1 (horizontal line) corresponds to no difference in expression levels between TCMR and Normal biopsies, TCMR/Normal = 1. For values plotted above 1, mRNA abundance in TCMR is higher than in Normal. For values plotted below 1, mRNA abundance in Normal is higher than in TCMR. Fold change was calculated using edgeR. The P-FDR is the probability value adjusted for FDR using the Benjamini-Hochberg method. The x axis is the log10P-FDR values; for example, a value of –5 corresponds to P-FDR = 0.00001. The 3 vertical lines correspond to P-FDR < 0.05, < 0.01, and < 0.001, respectively. (A) mRNAs for transmembrane TLRs. (B) mRNAs for transmembrane CLECs, CLRs, and mannose receptors.(C) mRNAs for transmembrane NLRs. (D) mRNAs for cytosolic RIGI-I–like receptors.

