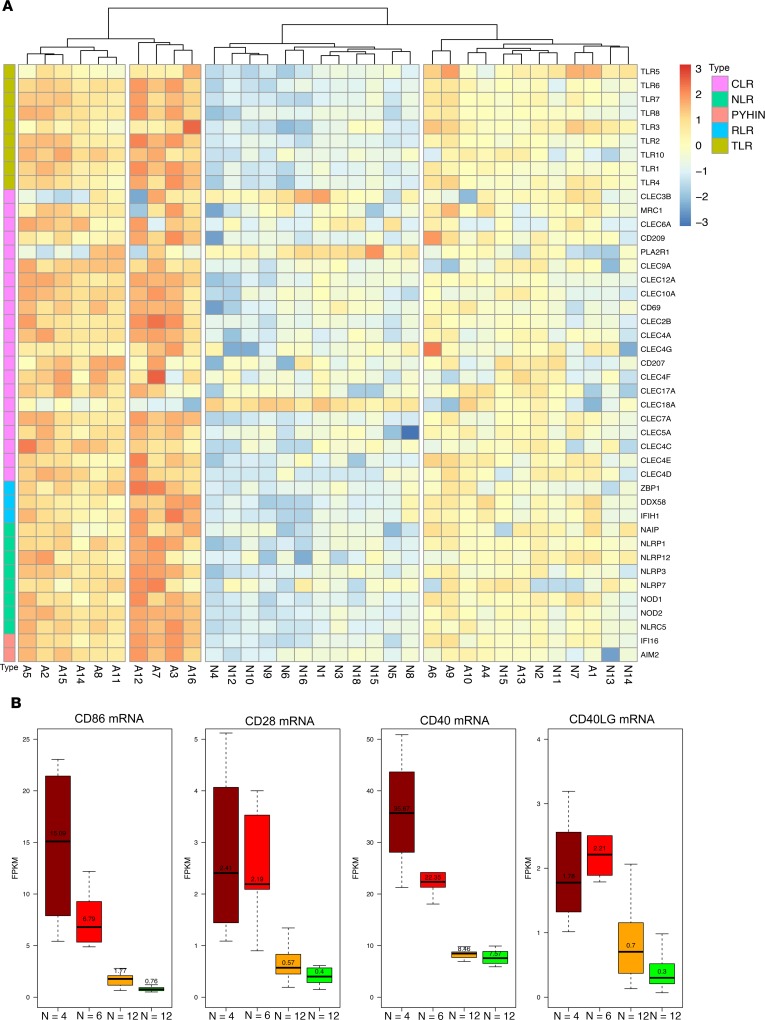
Figure 10. Relationship between mRNA abundance of PRRs and T cell costimulatory molecules in TCMR and Normal.
By hierarchical clustering analysis of the differentially expressed PRRs (A), the 34 kidney allografts (TCMR: A1–A16, Normal: N1–N18) separate into 4 groups. We labeled the groups as dark red (highest gene expression, middle left, N = 4), red (left, N = 6), orange (right, N = 12), and green (lowest gene expression, middle right, N = 12). Signaling through PRRs culminates in costimulation of T cells. Box plots (B) depict the expression of T cell costimulatory molecules CD86 (B7-2, expressed on APCs and serves as a ligand for 2 T cell proteins, CD28 and CTLA4), CD28 (T cell surface protein that provides signals needed for T cell activation and survival), CD40 (present on APCs and required for its activation), and CD40LG (present on T cells and serves as a ligand for CD40) in the 4 groups.

