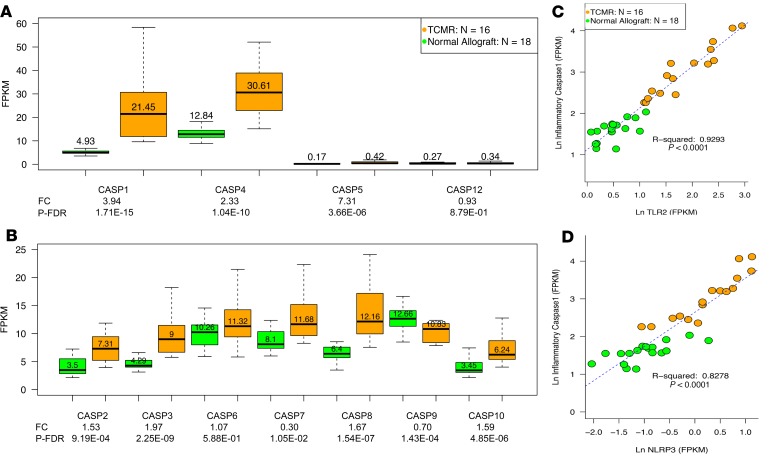
Figure 2. Intragraft abundance of mRNAs encoding caspases in human kidney allograft biopsies.
mRNA abundance of inflammatory (A) and apoptosis caspases (B) in TCMR and Normal. The number in each box plot is the median value of mRNA abundance as fragments per kilobase of exon per million reads mapped (FPKM), which normalizes the RNA sequencing data for sequencing depth (per million scaling factor) and the gene length (per kilobase scaling factor) and was assessed with Cufflinks. The fold change (FC) values shown beneath the x axis and the P-FDR were calculated using edgeR. Signaling through PRRs activates caspases. There were strong associations between several PRRs and caspases. As an example, the association between mRNA expression levels of the key inflammatory caspase, caspase 1, and TLR2 (C) or NLRP3 (D) are shown. The strength of the association is expressed as the coefficient of determination (r2). NLRP3 is a key component of the inflammasome, which is a multiprotein complex of receptors and sensors that regulate the activation of caspase 1 and induce inflammation.

