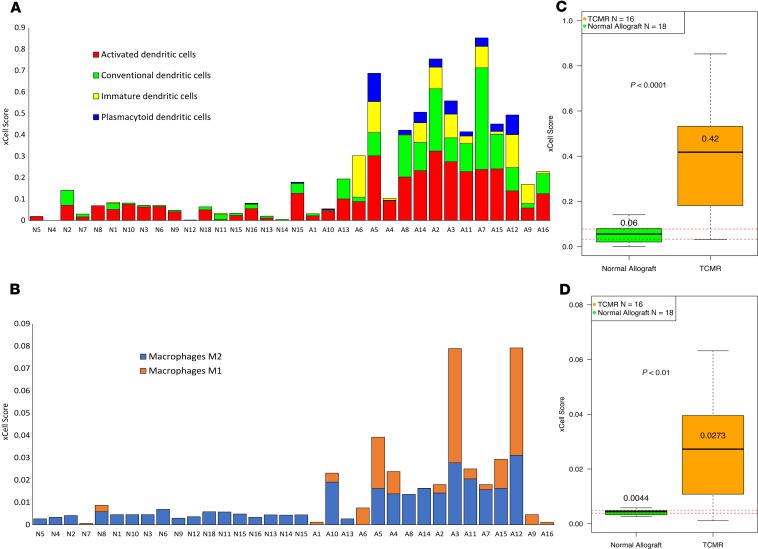
Figure 7. Cell-type enrichment scores for DCs and macrophages in TCMR and Normal.
Distribution of cell-type enrichment scores for DCs (A) and macrophages (B) in individual TCMR and Normal samples. We used xCell, a bioinformatics tool, to provide an enrichment score for different cell types that allow comparison of cell types across samples (not across cell types within a sample). The y axis represents the xCell enrichment score (not a percentage). The height of each stacked bar column represents the total DC or macrophage xCell score for that sample. The figure also depicts box plots of total DC score (C) and total macrophage score (D) in TCMR and Normal. The difference in total DC score and the total macrophage score between TCMR and Normal were statistically significant by Mann-Whitney test.

