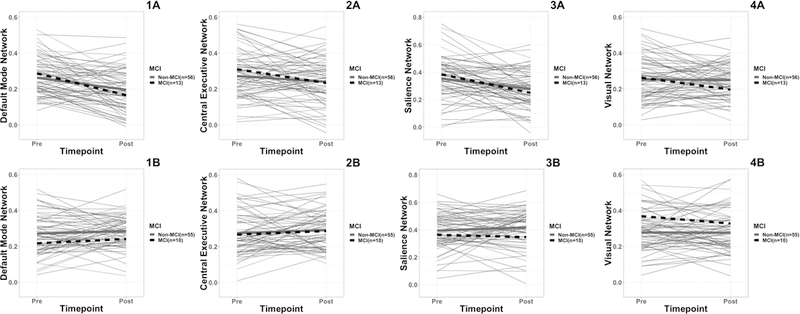
Figure 3.

Plot of mean pre and post functional network connectivity values for MCI and non-MCI surgery (A) and non-surgery (B) groups. Thinner lines are individual participants (grey are non-MCI and dashed black are MCI). Thicker lines represent group means (grey are non-MCI and dashed black are MCI). Y-Axis is correlation coefficient. 1A = DMN connectivity surgery group; 1B = DMN connectivity non-surgery group; 2A = CEN connectivity surgery group; 2B = CEN connectivity non-surgery group 3A = SN connectivity surgery group; 3B = SN connectivity non-surgery group; 4A = VN connectivity surgery group; 4B = VN connectivity non-surgery group.
